Due Dates
Assignment: Midnight, Wednesday October 9
Presentation: Thursday October 17 (delayed due to fall break)
Initial comments: Midnight, Monday October 14
Comment responses: Midnight, Wednesday October 16
Description
The purpose of this assignment is to explore how we can “physicalize” data in three dimensions. You will create a family of at least three forms that explore one dataset. These forms can be any type of form you wish, i.e.: a 3D plot, a vessel, etc. You should find and explore a new dataset, one that is different than the ones we have explored in class. Your forms should illuminate an important and meaningful aspect of the data. A person should understand something about the data by looking at and/or handling each form. Moreover, the collection of forms should convey something as a set. Each form should have a volume of at least 12 cubic inches (200 cubic centimeters), i.e.: 2x2x3 inches. Plan ahead. Expect each print to take at least 10 hours.
What to Hand In
Create a post on this website that documents the work that you did. Your post should include:
- Dataset. Provide a link to your dataset. Describe how and why you chose your dataset. Describe any data cleaning and filtering that you had to do.
- Design Process. Describe how you used your data to generate 3D forms. Explain why you chose the forms you did. Explain what each form illuminates or teaches you about the data. This explanation should include a clear description of the units and scale you used for each of your objects.
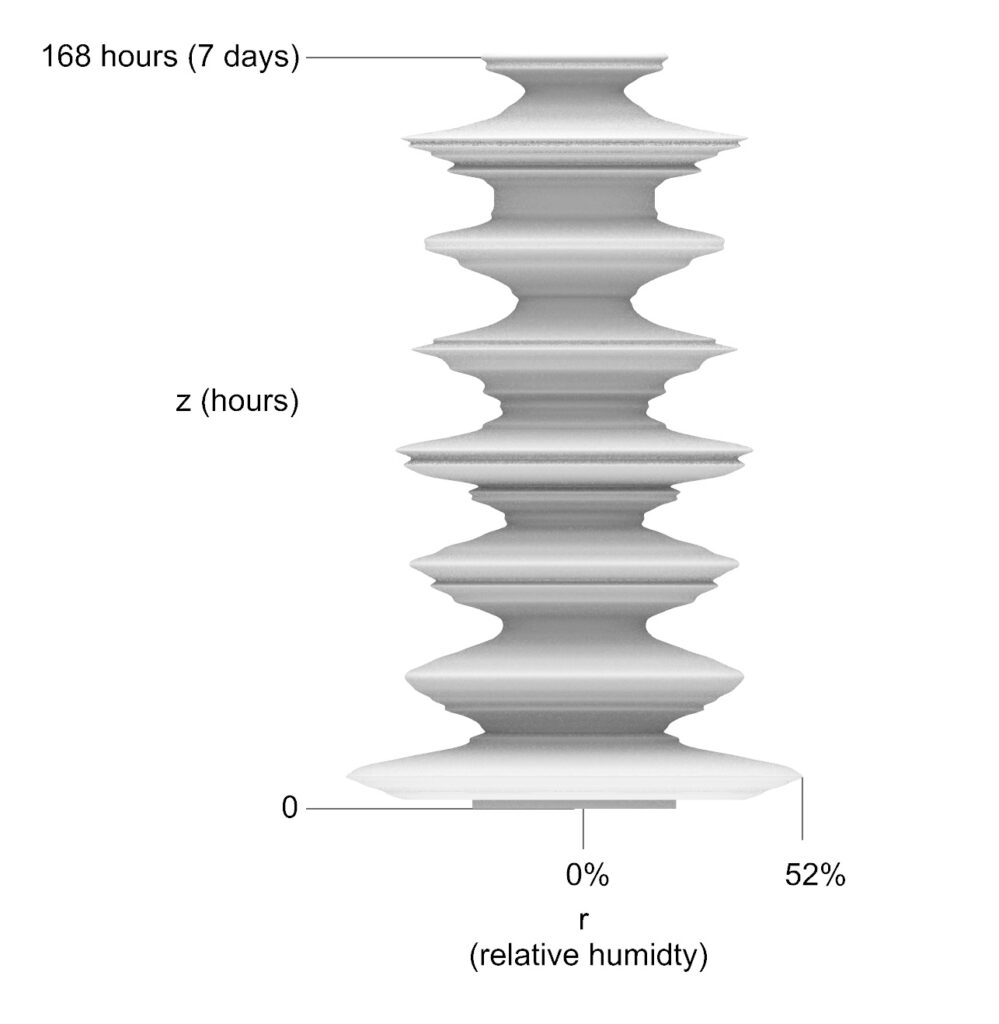
- Images of forms generated by your Grasshopper/Rhino program rendered in Rhino. These images should include labels for each relevant axis of your object. (i.e.: If you are creating a 3D plot, you should have x, y, and z labels. If you are creating a vessel, you should have r and z labels.) Labels should include units. We should be able to quickly understand how the scale of your object (in mm) relates to the scale of the data you are using (in the relevant data unit). See below for an example.

- Excellent images of your final printed artifacts against a simple background. Follow the photo tutorial.
- A reflection on designing with data, 1-3 paragraphs. (How) can 3D objects help people understand data? What does the process of creating objects via with data let you do that you could not do before? What (unique) meanings can such objects have?
- Your Grasshopper code. Name your program using the following convention: FirstnameLastnameLA3.gh. Upload the .gh file to the website and include a link to it in your post.
- Follow the Code Style Guidelines. Add a header to your Grasshopper program, as described in the guidelines.
Add your post to the “Large Assignment 3 – Data” subcategory, under the Student Work 2024 category.
Some good places to find data:
US Governmental data: https://www.data.gov/
City of Albuquerque data: https://www.cabq.gov/abq-data/
Forest Service data: https://data.fs.usda.gov/geodata/edw/datasets.php
Physiological data: https://physionet.org/
An example of a beautiful data physicalization project from 2023 by Camila Friedman-Gerlicz.
Discussion
Read all of your classmates’ posts and comment at least three of them. Try to comment on projects that haven’t been commented on or that have fewer comments. Comment on both the artifact and reflections.
Respond to at least two comments. If you don’t have enough comments, respond to what you can.