For this assignment, I chose to use the demographic information provided by the National Oceanic and Atmospheric Administration that addresses salmonid population in the Pacific Northwest from 1949 to 2010. As for why I chose this, well, I love salmon, haven’t had sushi in a while, and Fat Bear Week is concluding!
There are five kinds of Pacific salmon: chum, sockeye, Chinook (or king), Coho, and pink. Atlantic salmon is usually farm-raised, and it just doesn’t taste the same as the other salmon.
The Dataset
The full data provided includes such specificity as the rivers they were counted in and whether it was a spring or fall salmon run. One particular thing I found affected my output was how they handled null or no count years. Null is not the same as zero, but in the data, it looks like they flagged it as “-99”. For the purposes of this project, I added those entries all together, as there were multiple entries for a year. I cleaned up the data to preserve what I was interested in: salmonid species, year, and count.
Grasshopper
One of the most difficult things that I encountered with this project was how to access and manipulate Rhino object data in a Python script, along with finding the right component to use with the output of another. Manipulating the data at an earlier stage before it renders into a 3d form turned out to be key to allowing for multiple forms from one Grasshopper file. Adding a selector that let me flip through the different species to output different shapes easily proved to be very useful and is something that I will be exploring in the future. Another thing that I learned how to do was to re-center a model and automatically scale the output of the modeling to fit my 3d printer’s build volume.
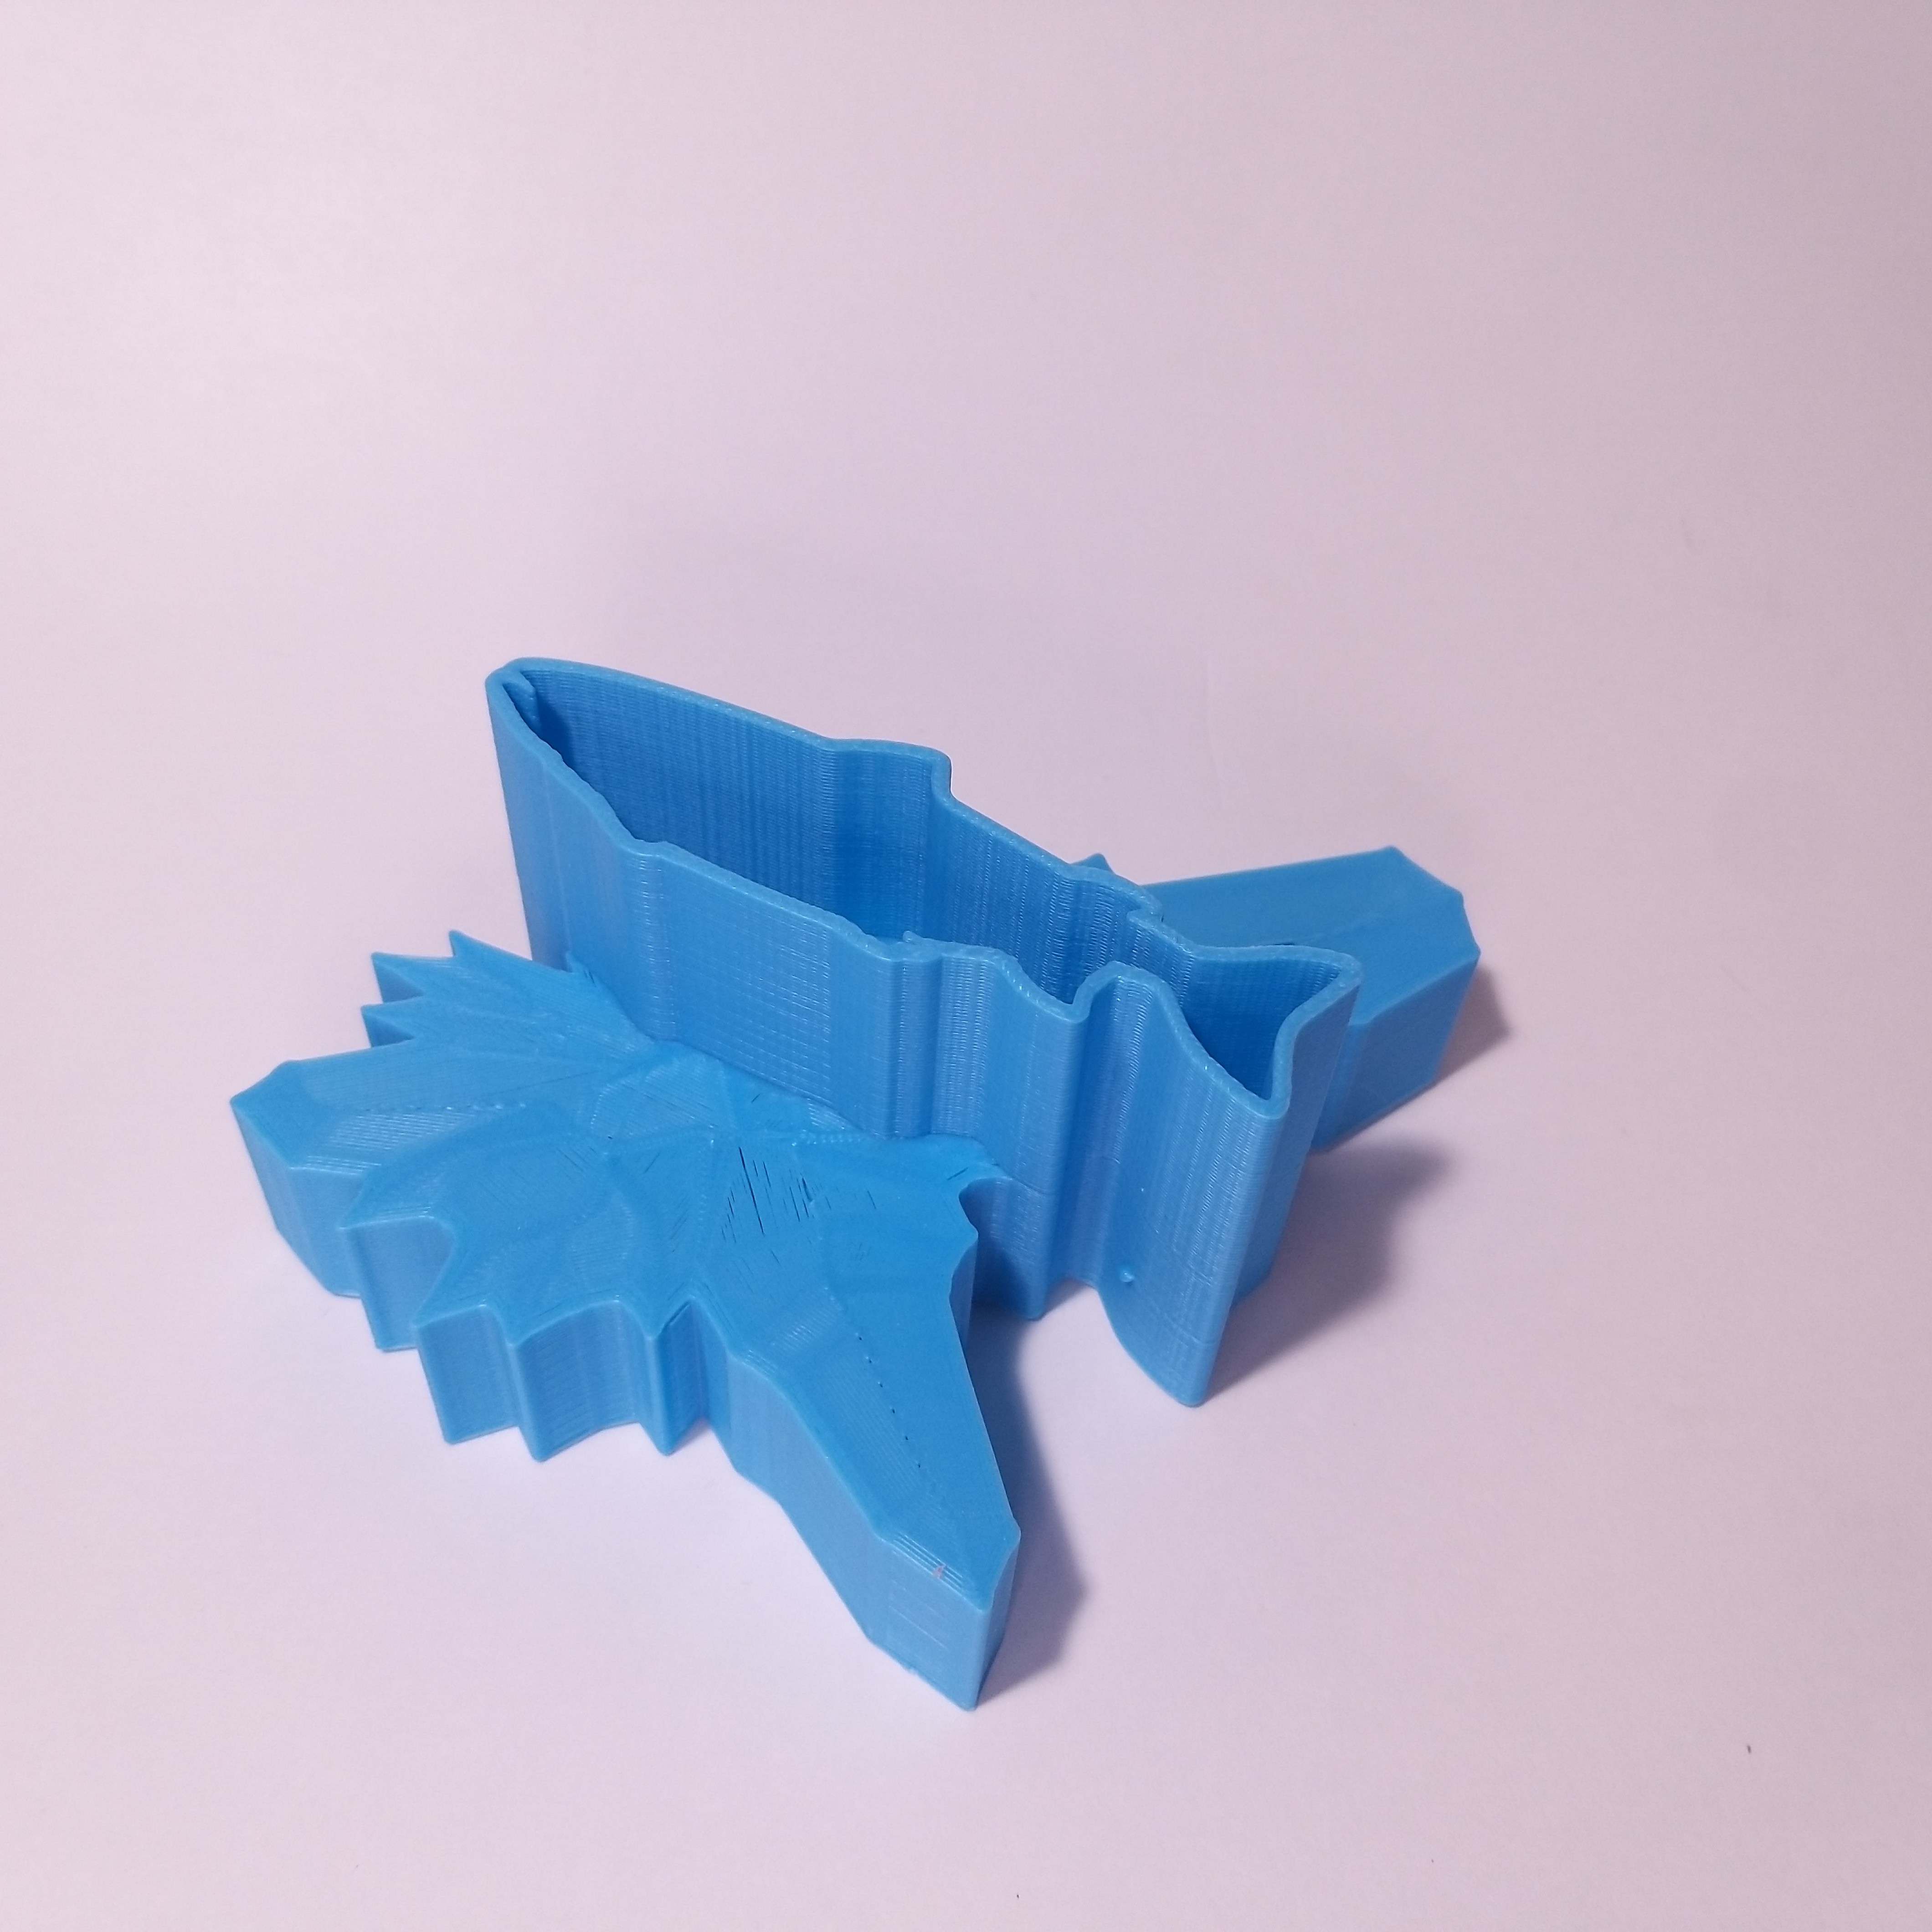
Another goal with this project is to find out ways to import images and then play with them in a 3d space. Most often, this means a vector file of some kind, and SVG is one of the more portable versions. It did require installing a different plugin than what we’ve used so far, but worth it for my workflow.
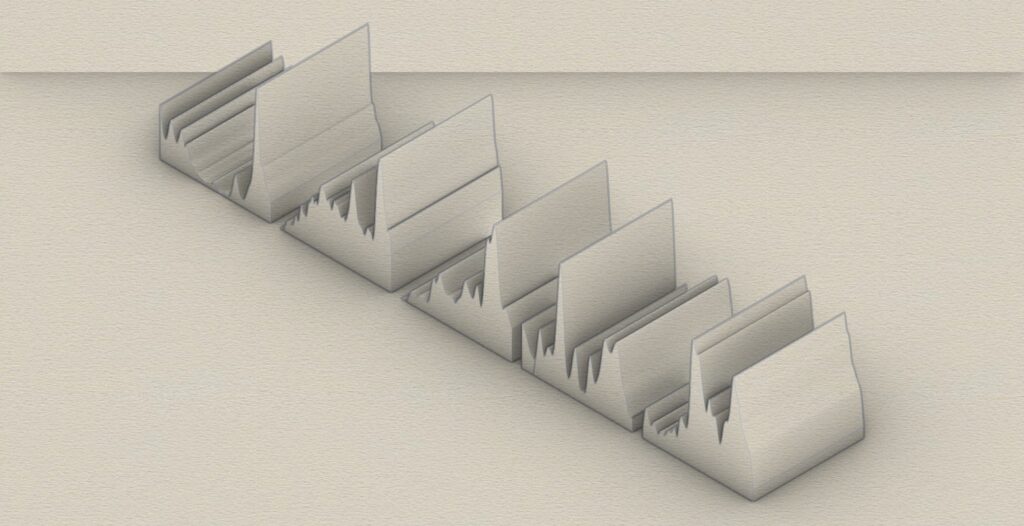
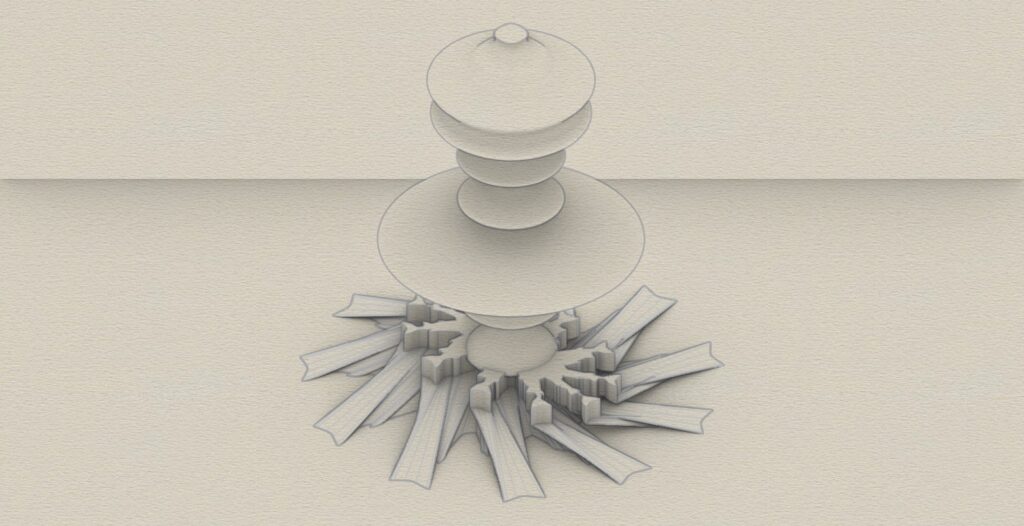
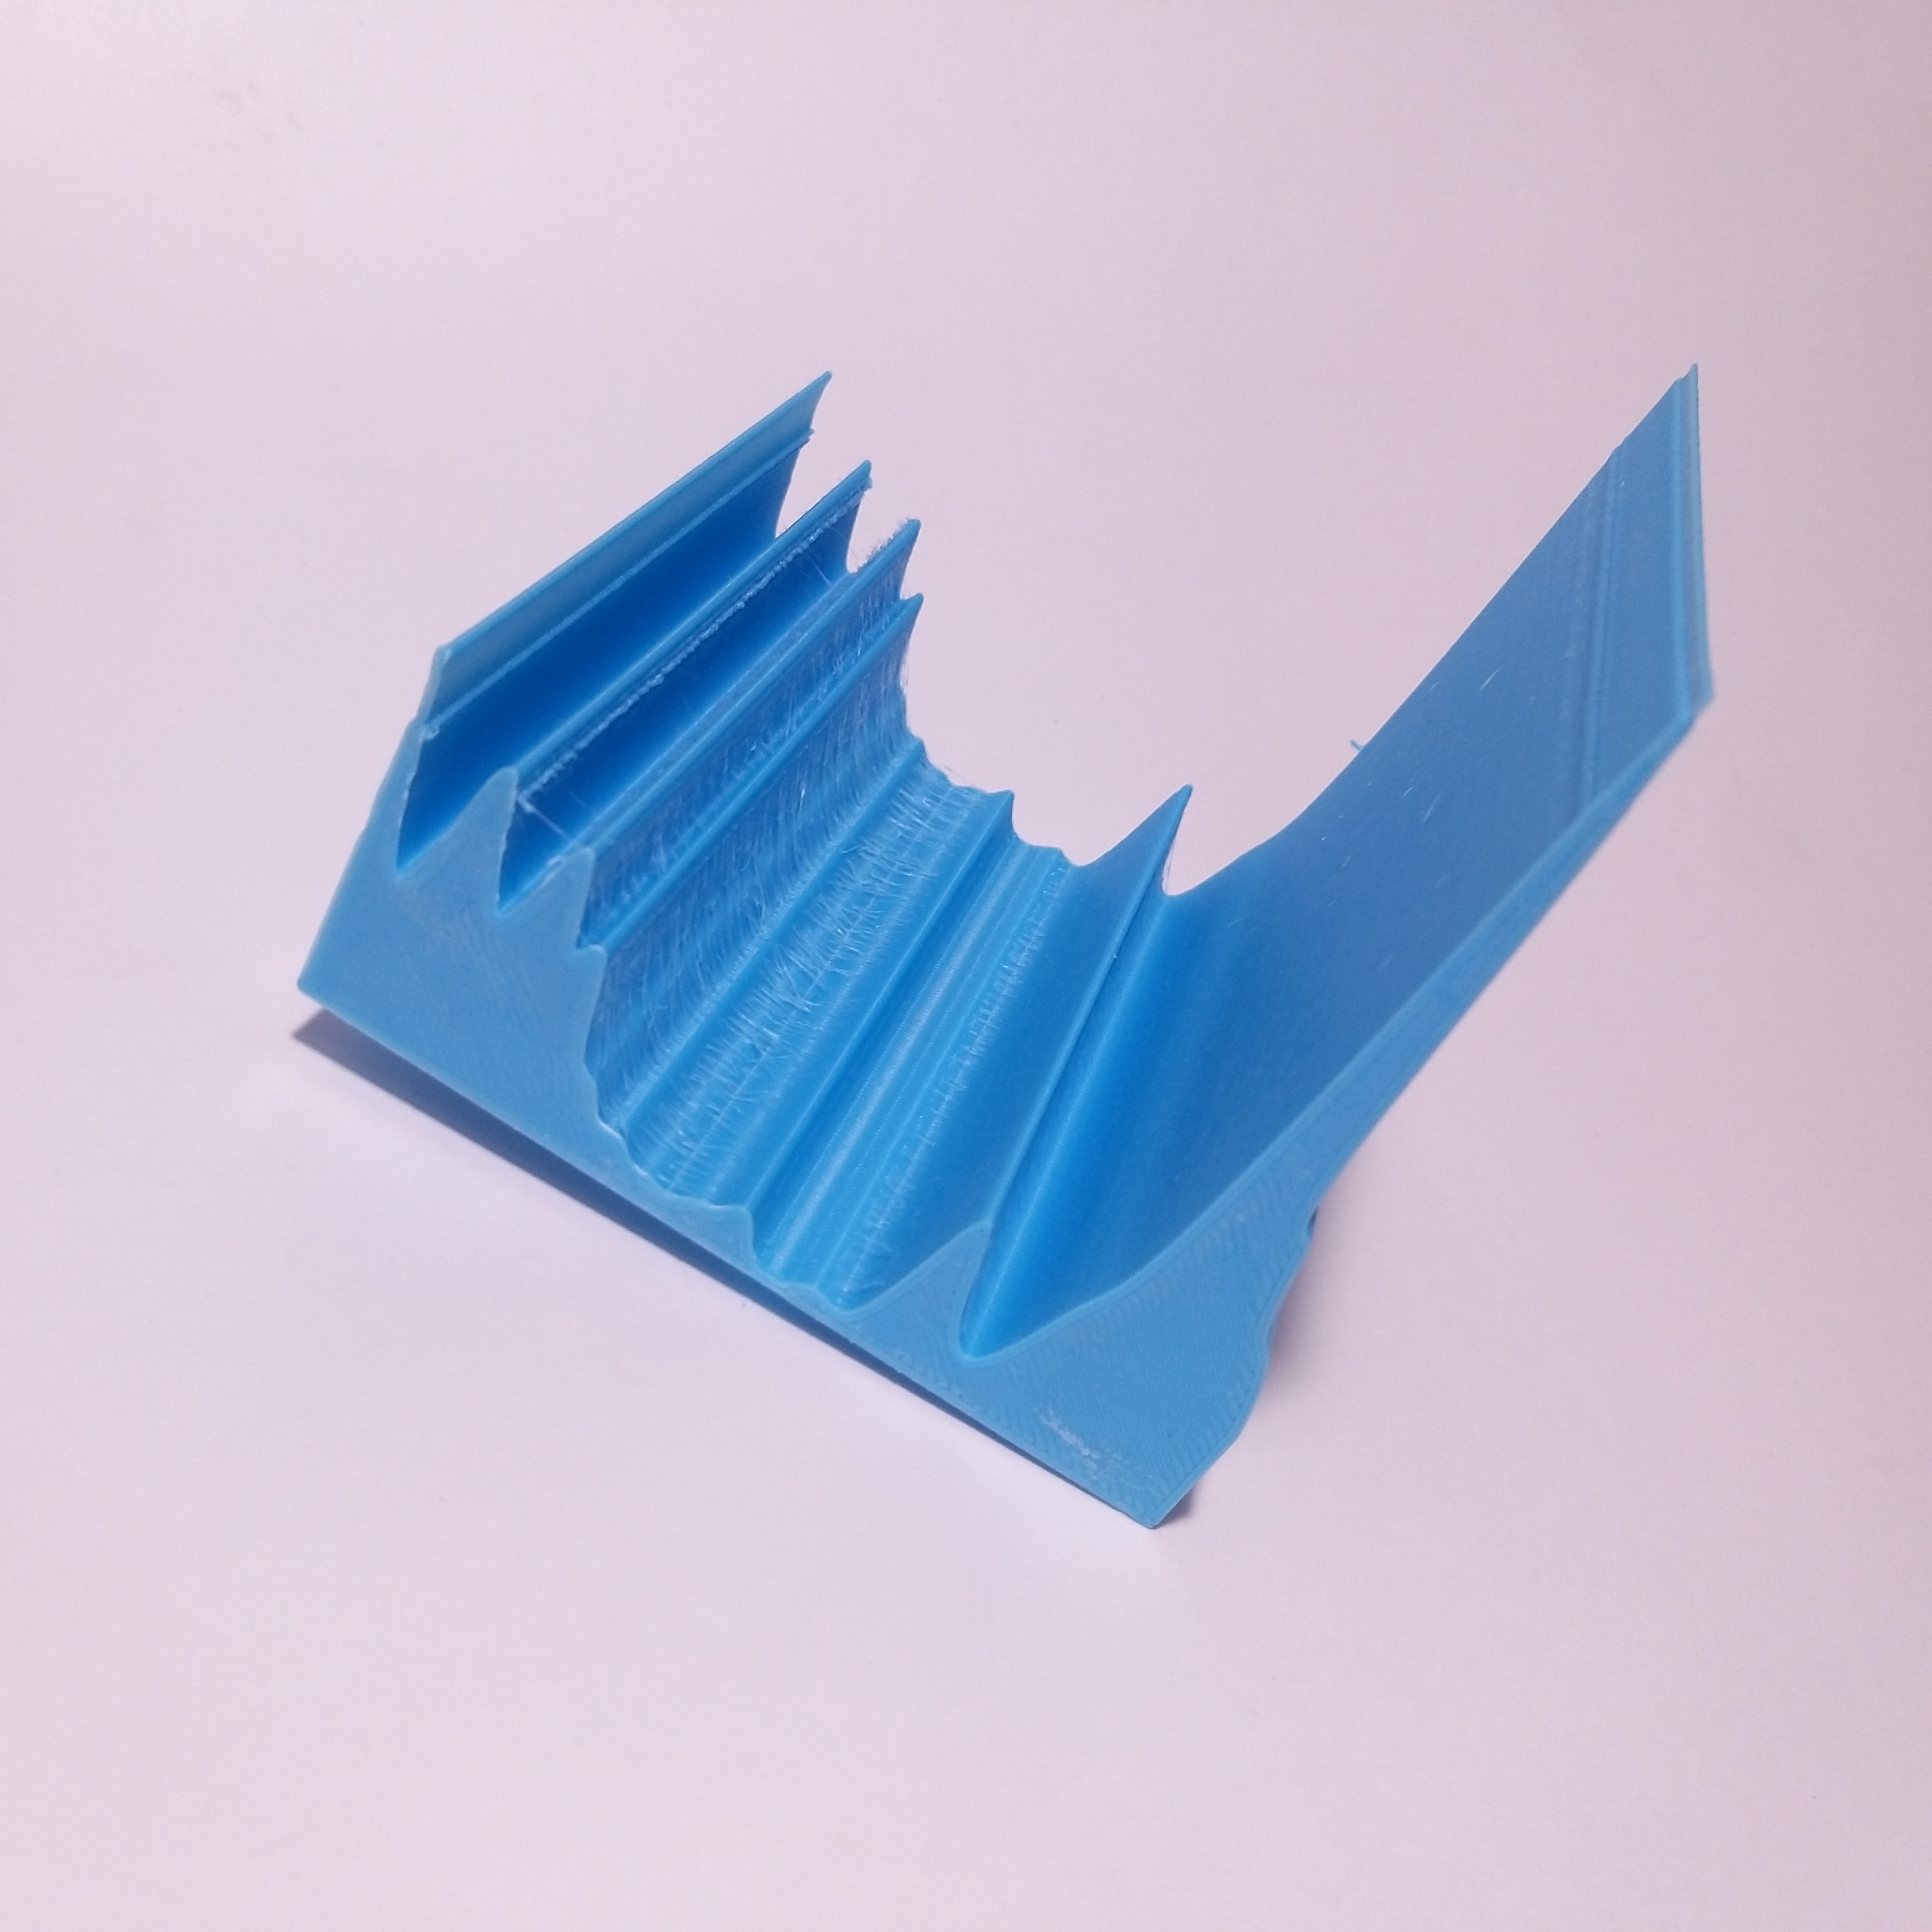
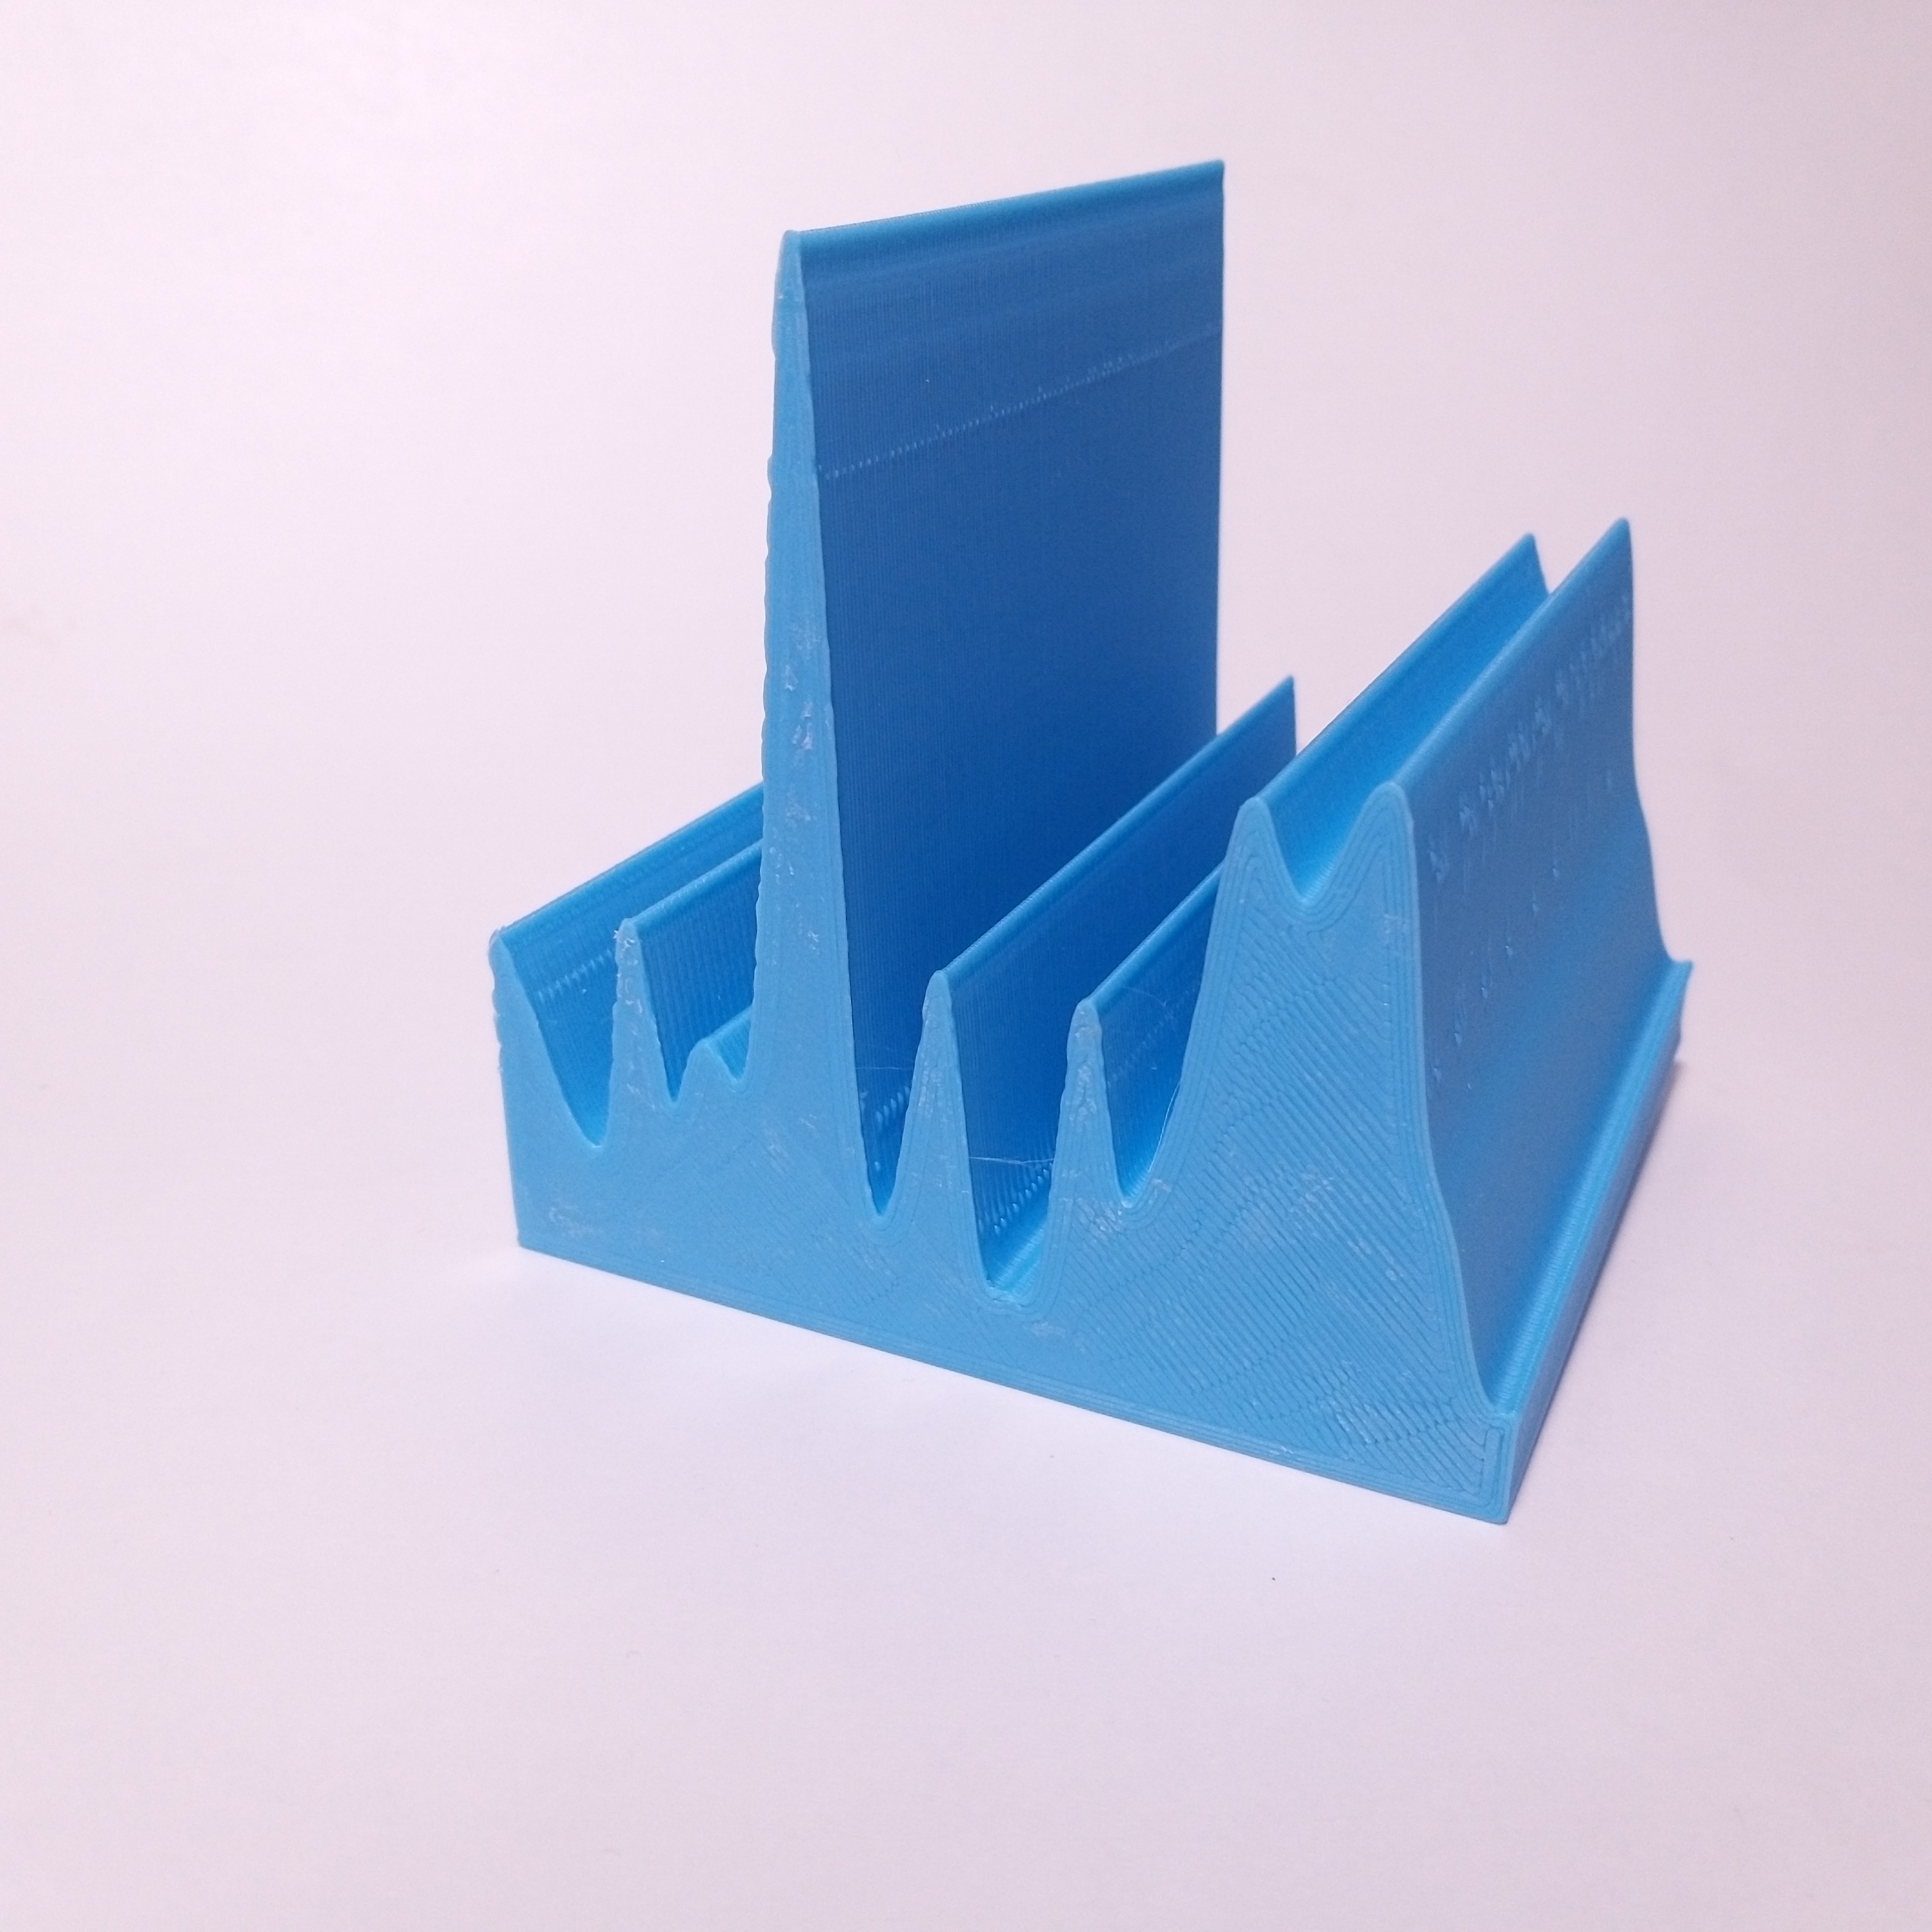
Because of the data I used, it did mean that some of the data was so low that it ran the risk of breaking the model because the points were so extreme. For the first model, I printed it on the side so that the peaks and valleys would be more visible. For the trophy model, the idea was hard from the get-go. The extremes of the data meant that the model was going to be difficult to print no matter what I did, and while it did print fine, one of the thin points did break when I was pulling off the supports. It would probably print just fine in a resin printer, but I did not have access to one for this project.
What I wish I had done was output a panel with some data: year range, minimums, maximums, and average for each species. The years in the data set were not consistent across all the species, and some years were not recorded at all.
Rhino

Final Photos
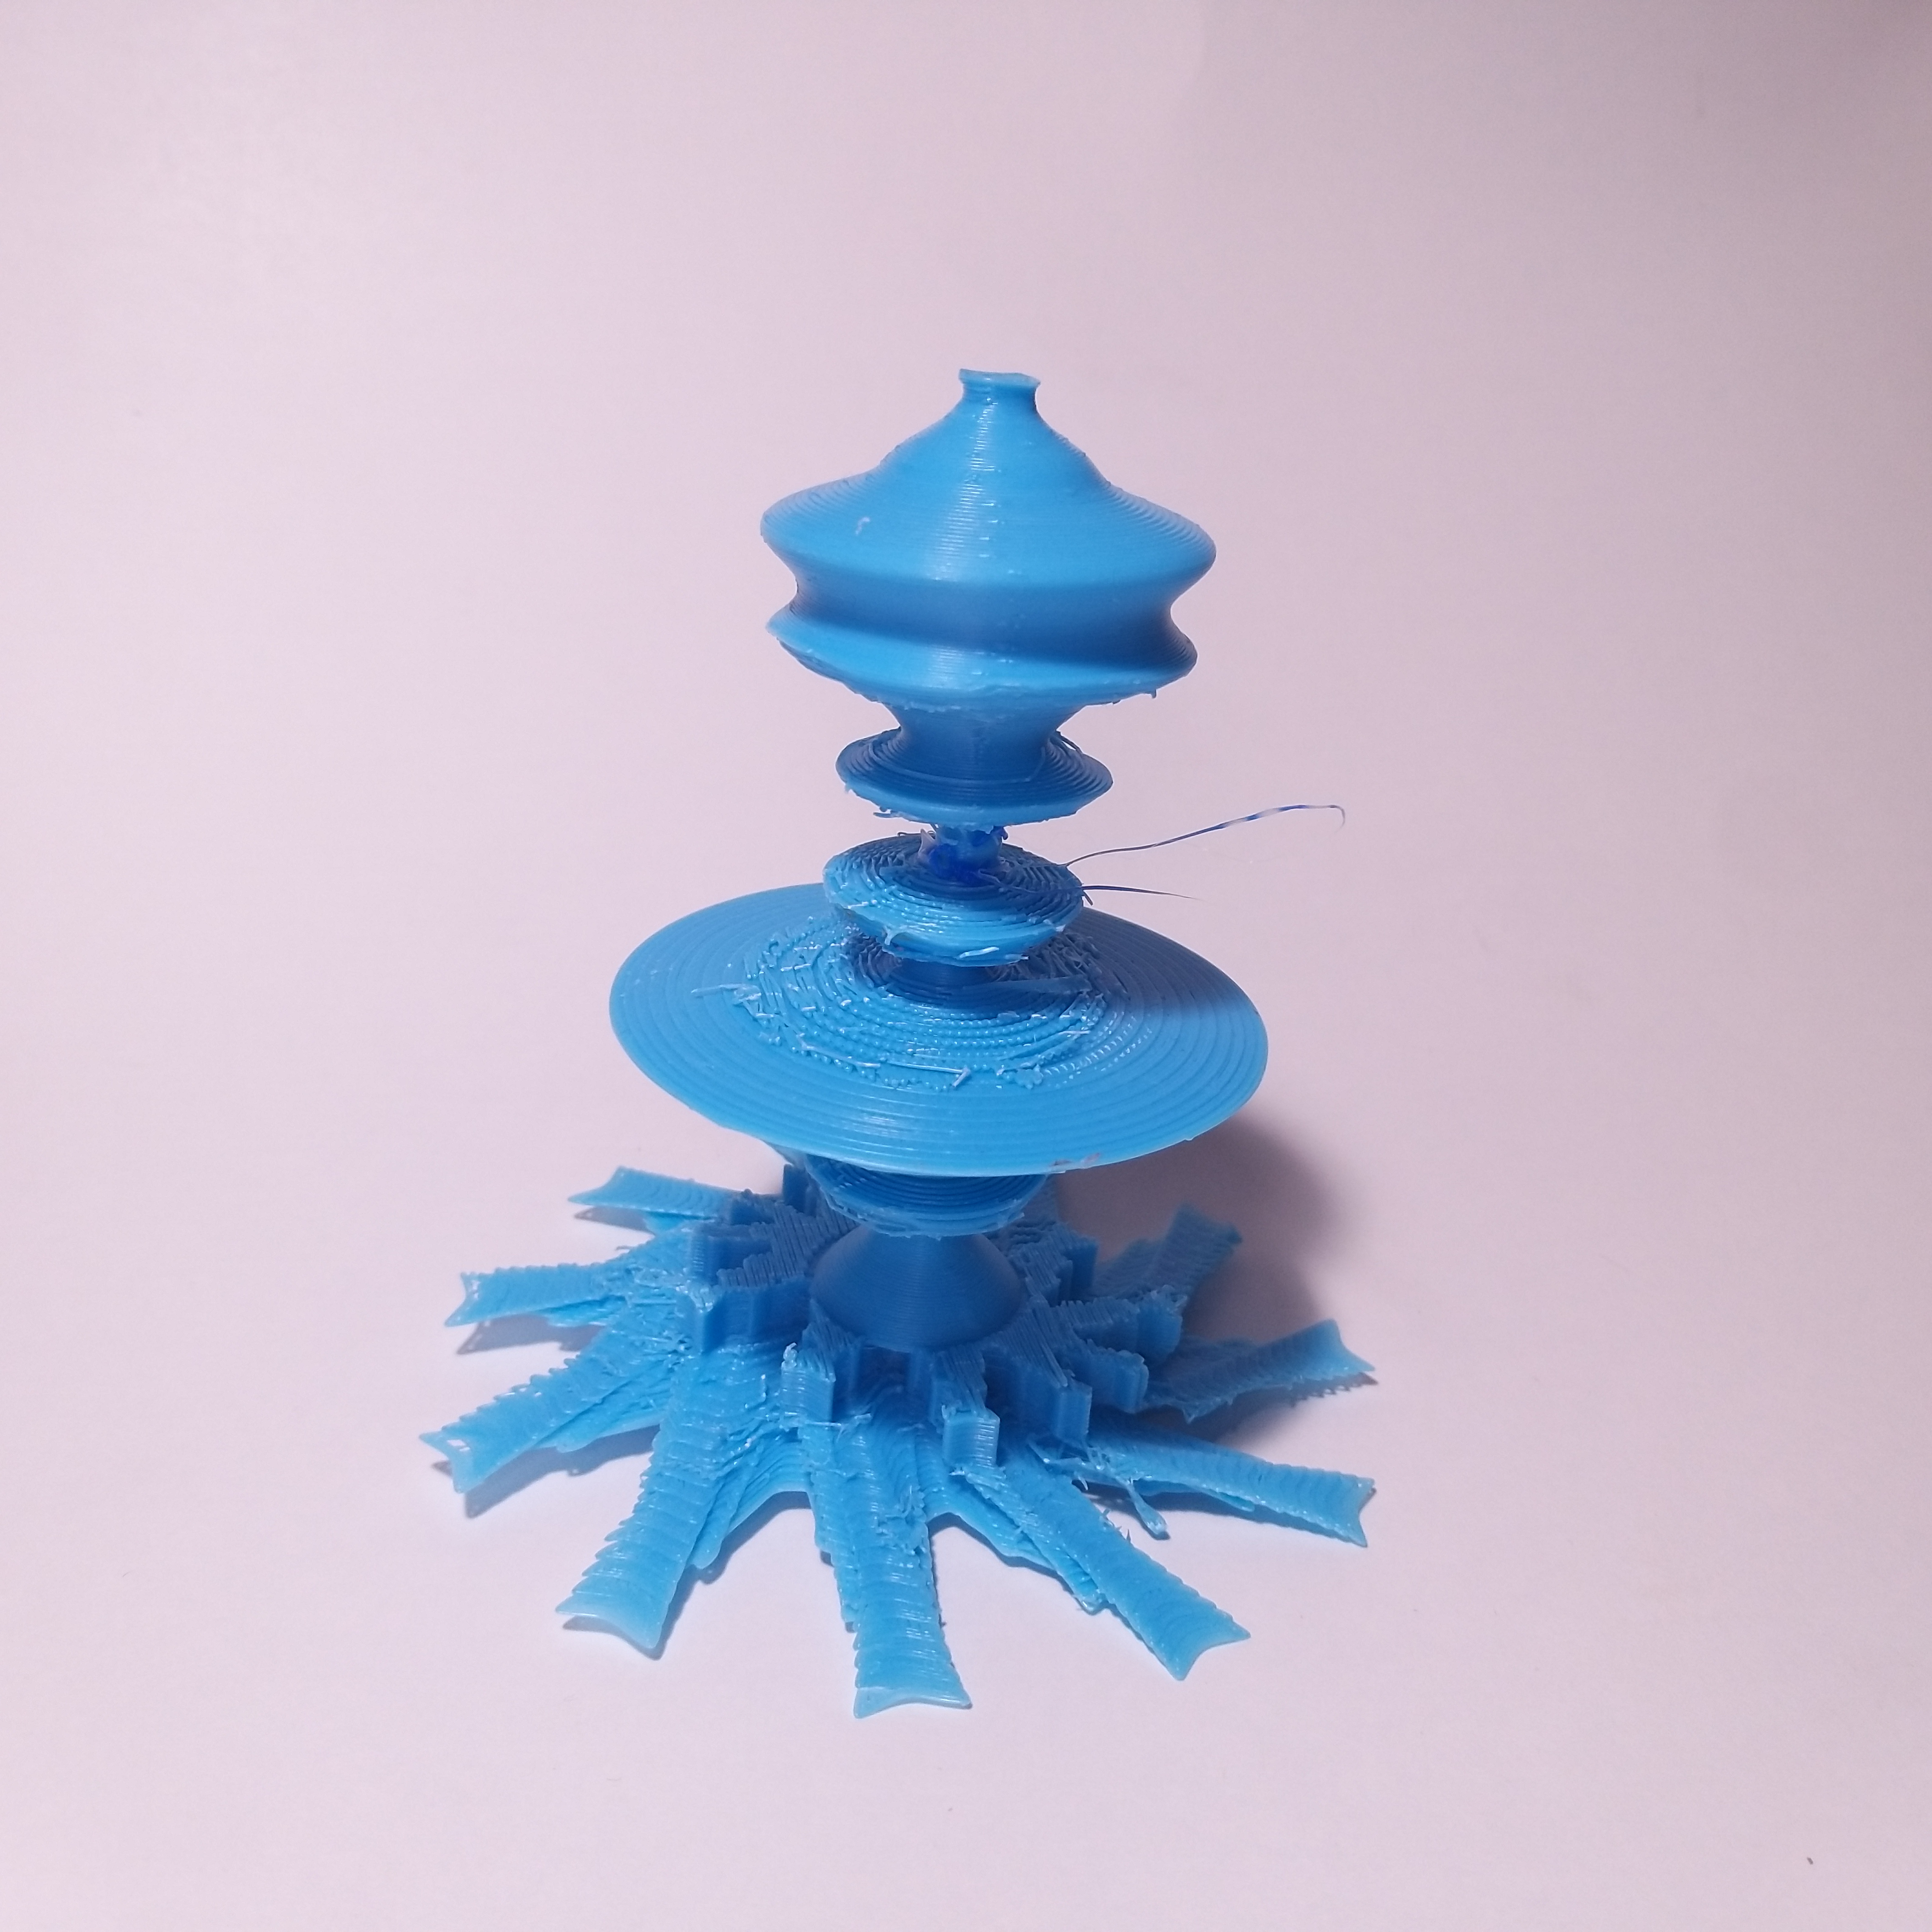
Most of my difficulties in fabrication lay in the extremes of the data sets and producing a viable form based on that. Aesthetically, I like the Sockeye Trophy the best, but I don’t think filament printing at this scale was the ideal way to go. Getting a good first layer adhesion with the lower layer heights I initially attempted did not work out well, but I think changing how I modeled the base would help.
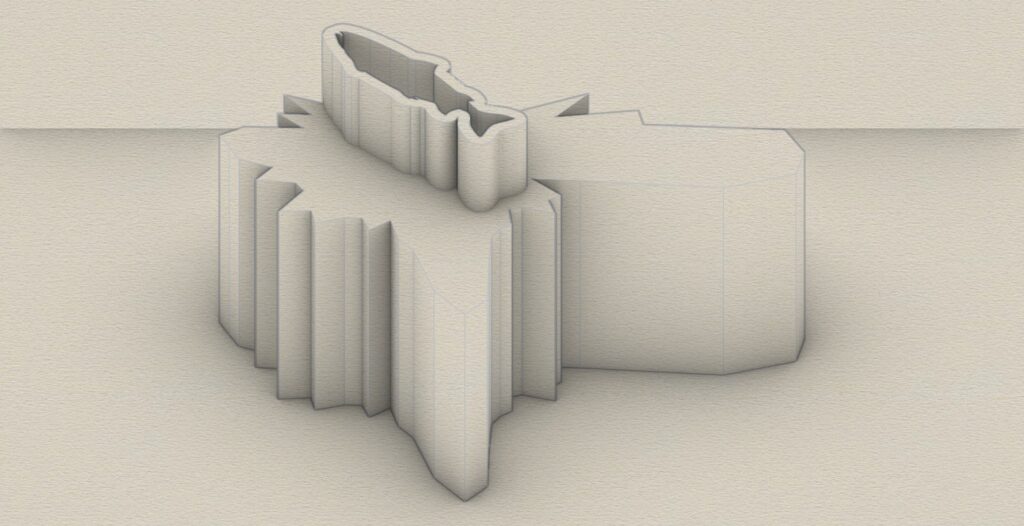
It’s cool how this data turned out physically, especially the Chinook as it was shaped as a fish. I’m sorry to hear that the Sockeye Trophy broke, but its great that you attempted to print this with how thin it was.
I think I might want to try the sockeye trophy again, but maybe scale it in such a way I can print it in three parts to account for the extremes in the model.
Hey Liz,
Diving into salmon demographics is a unique and cool idea! Your challenges with the data extremes gave your models a unique character, especially that Sockeye Trophy. Look forward to see your next project!
Best,
Daniel
Hi Liz,
your project came out so neat! I especially liked how you added the fish images to your 3d prints. I thought that was very clever. I am so stuck on sticking strictly to my designs, that I don’t feel like I have the creativity to think outside of the box. You inspired me to think a bit further than just what’s required.
If I have learned anything as an artist in the last twenty-ish years, is that creativity is a muscle and you gotta exercise it. One of the fun parts of this class for me is how to have fun with the data and play with the presentation: how to take it and make an interesting shape with it (like the Chinook). I am fortunate that I took an “Artists Using Data” class (ARTS 429, for those that are interested) so playing in that space is not unfamiliar to me.