Data to 3D-Print 1
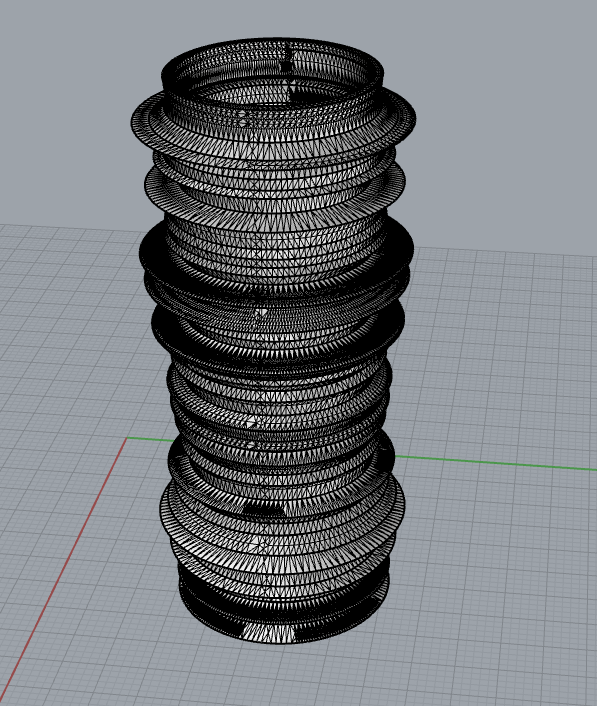
For my first print, I was looking at ABQ data and thought It’d be cool to create a bar graph representing the average income of government workers. Of course, I had to clean and filter the data and managed to create this bar graph. I originally planned on 3D printing this into a vase, but couldn’t get the offset right and only have 1 polysurface. Somehow I managed to create my 3D object, but I went with more randomized data as it looked cooler.
https://www.cabq.gov/abq-data/
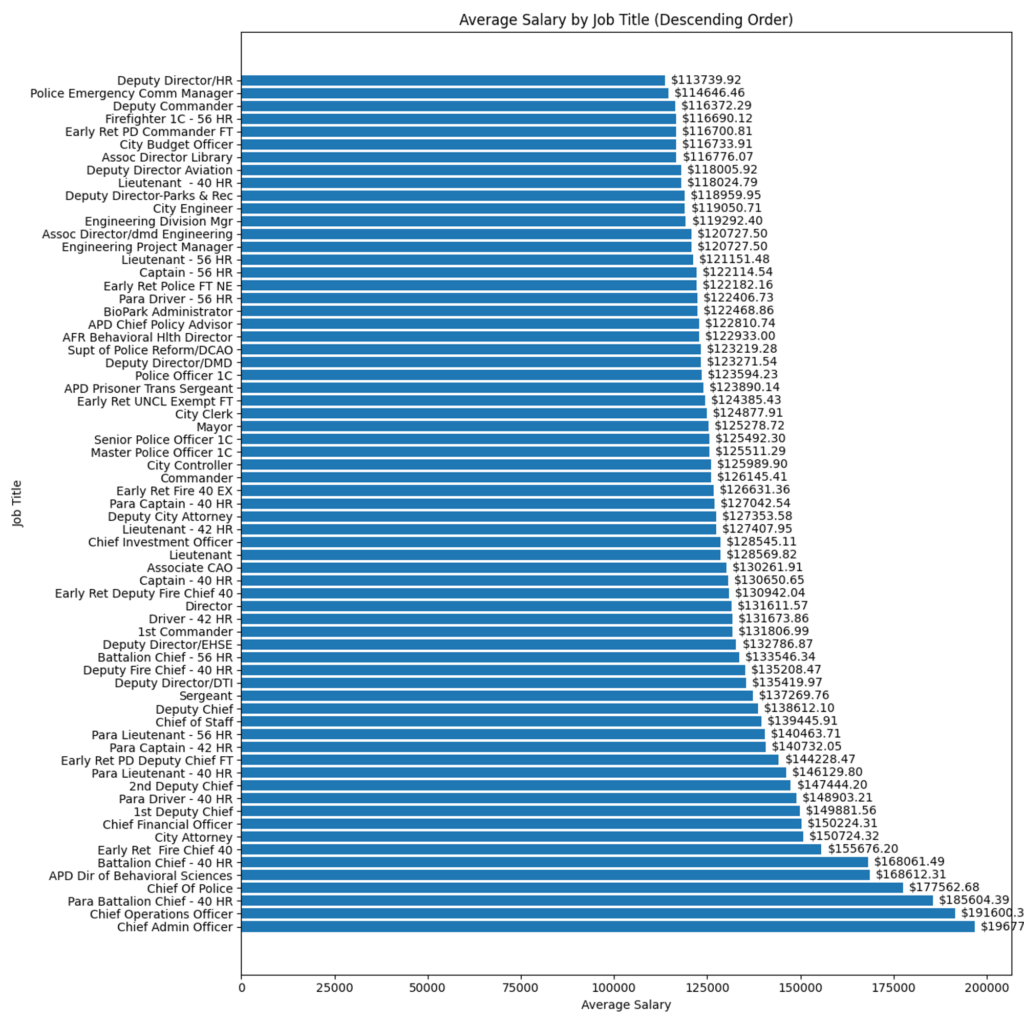
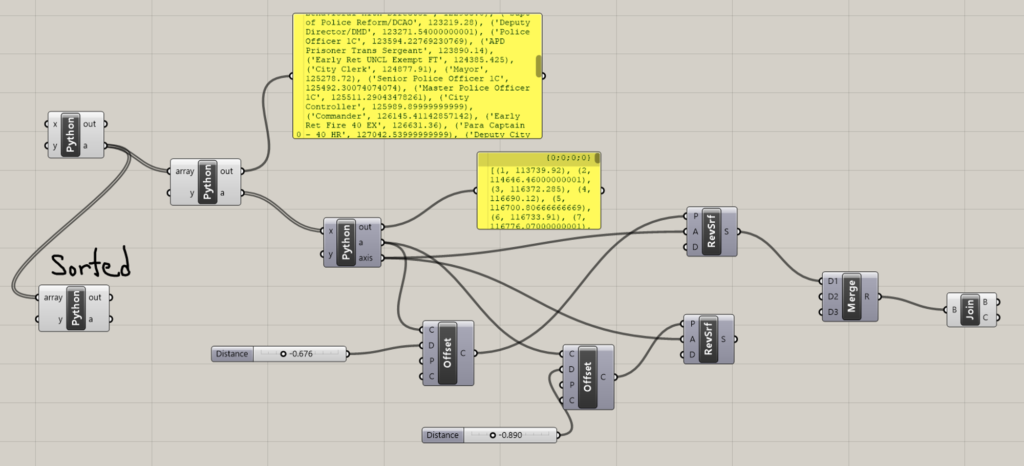
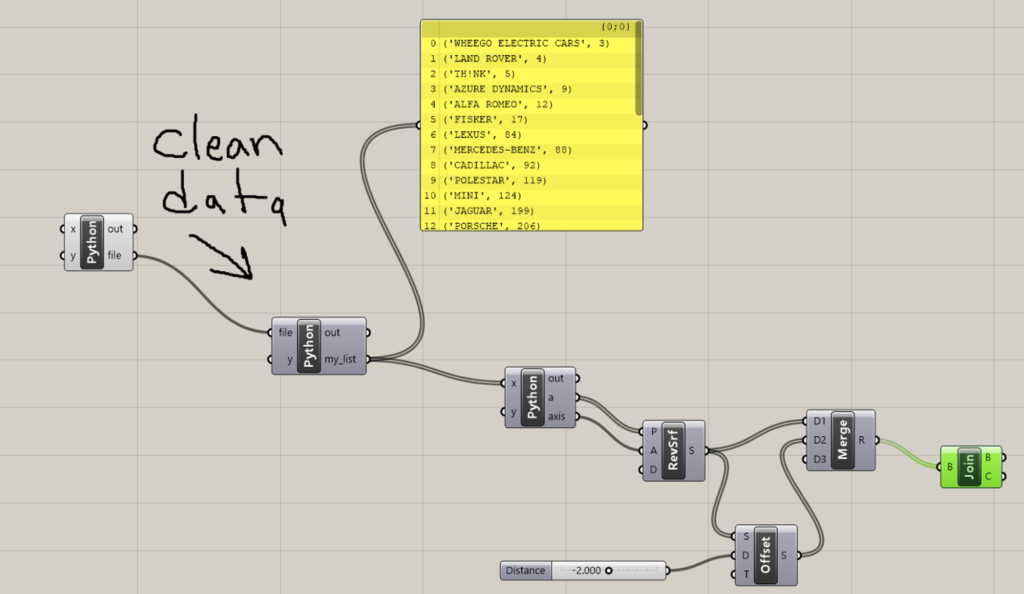
I managed to create my Grasshopper code following the class slides. I tweaked it a bit to get my data to plot correctly. I first cleaned my data so it gave me an array of tuples with the job title and the salary, I then created another Python block that created an average salary for that job. Now, I can’t plot job titles, so I just assigned them by numbers.
Data to 3D-Print 2
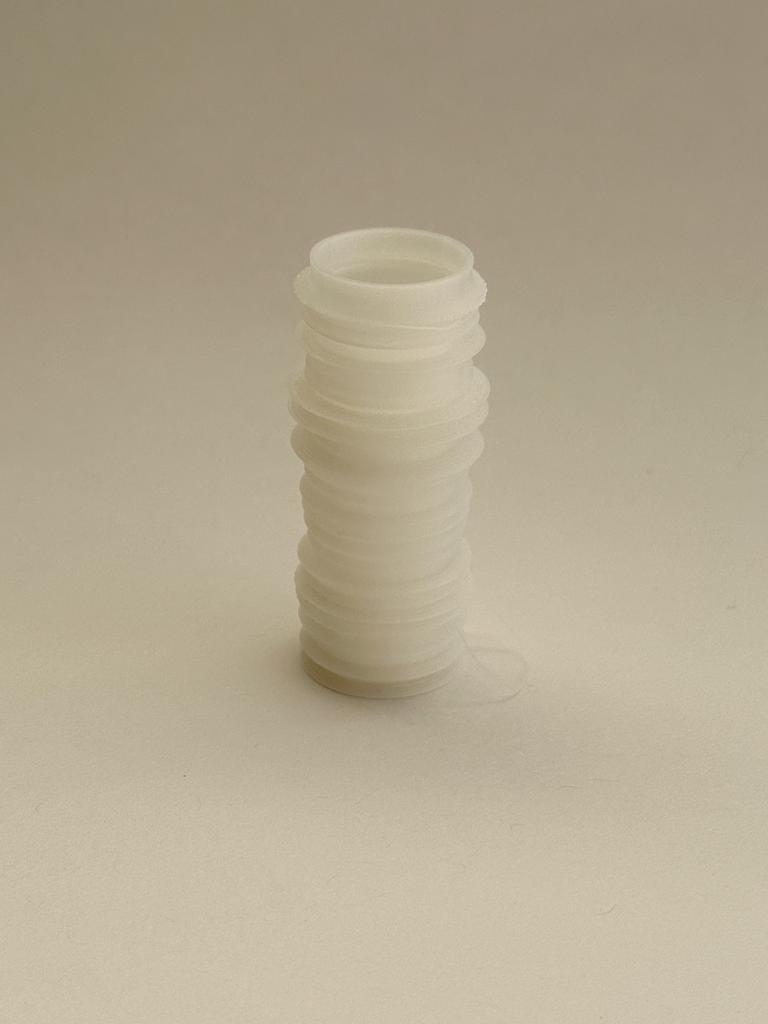
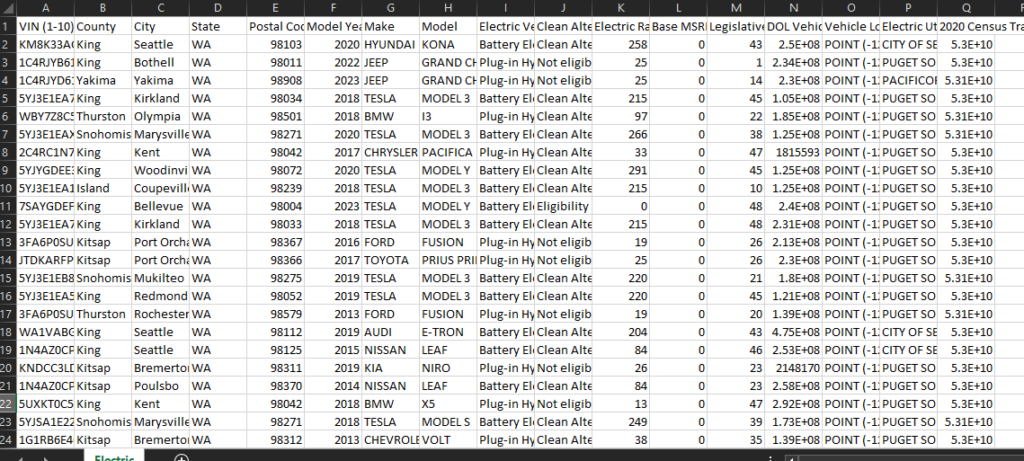
For this print, I had lots of trouble with the data. There was a lot of data I had to filter it to my liking. This 3D print is a graph that captures the Battery Electric Vehicles (BEVs) and Plug-in Hybrid Electric Vehicles (PHEVs) that are currently registered through the Washington State Department of Licensing (DOL). I managed to only get the Brand of the vehicle, and the number of registered vehicles to that brand.
https://catalog.data.gov/dataset/electric-vehicle-population-data
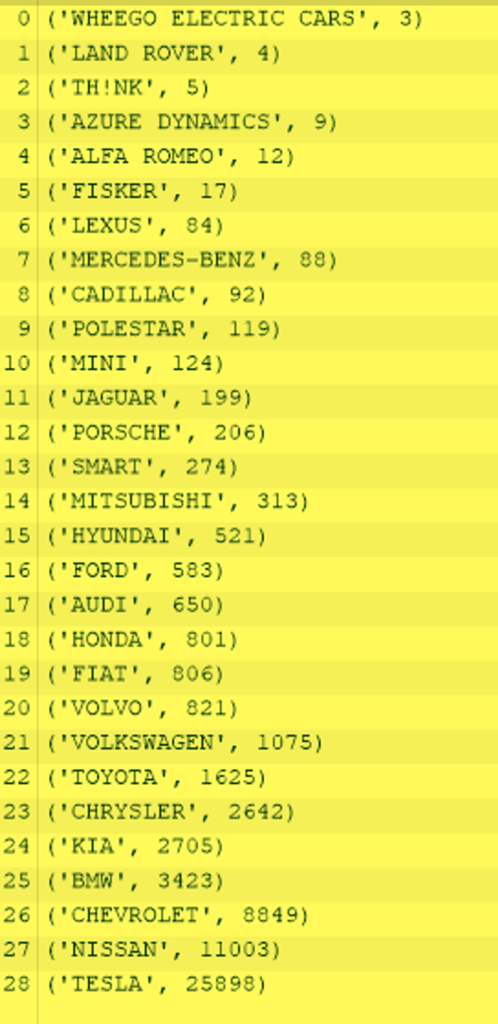
Of course, as you might see, Tesla has the most electric vehicles registered in Washington state. The file, however, was BIG, it was 33MB. I had to delete columns so there wasn’t an issue opening this file in Rhyno.
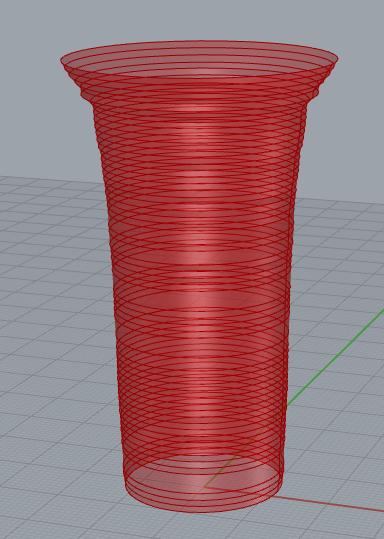
With this, I was able to print my vase. As you can see, they still have supports, I figured that the bottom would be unable to stand on its own, so I put supports and left them on the vase.
Data to 3D-Print 3
For this last 3D Print, I found data from the New York Lottery website for past Mega Millions results and payouts. Handling this data was easier than the other prints. What I did for this print was create an array of winning numbers, so { [1,2,3,4], [5,6,7,8] …..} from the data. I then got the number of occurrences for each number.
https://catalog.data.gov/dataset/lottery-mega-millions-winning-numbers-beginning-2002
From the list I created, I got the top 4 winning numbers. So, 31 appeared on 214 people’s winning numbers, 10 appeared on 210, 20 appeared on 209, and 14 appeared on 208 winning ticket numbers.
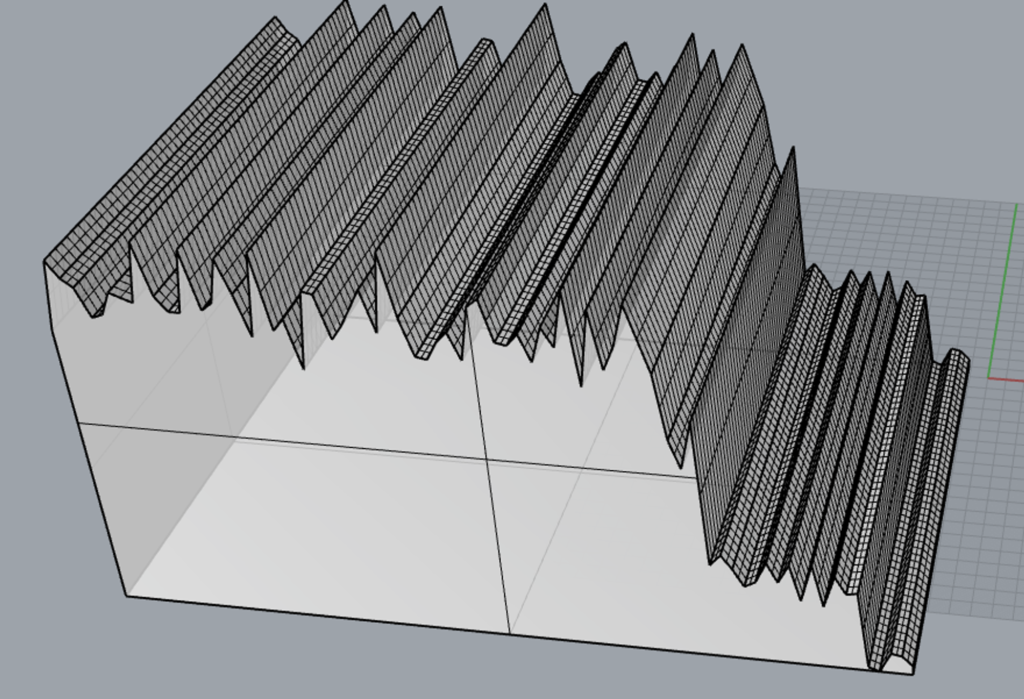
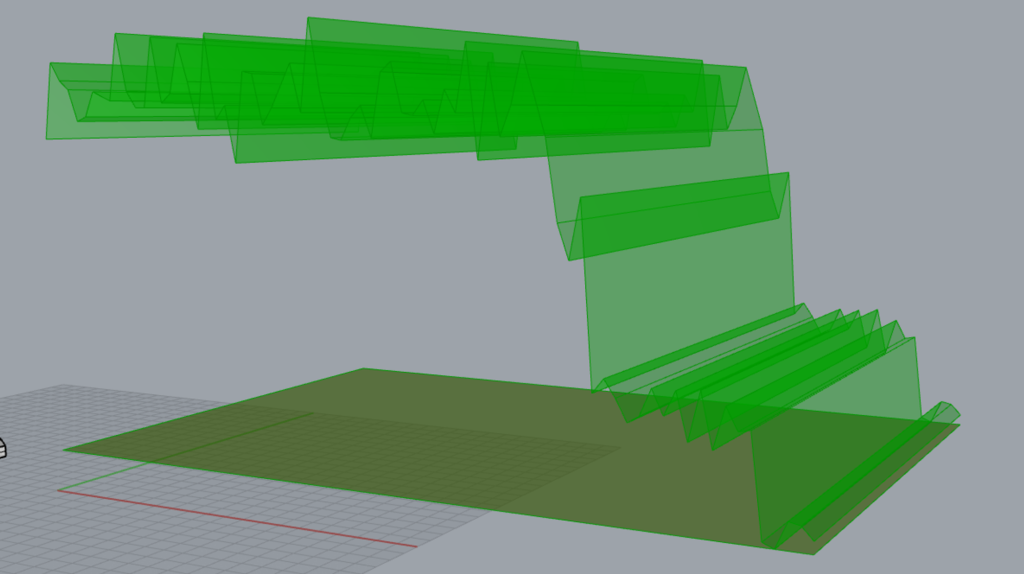
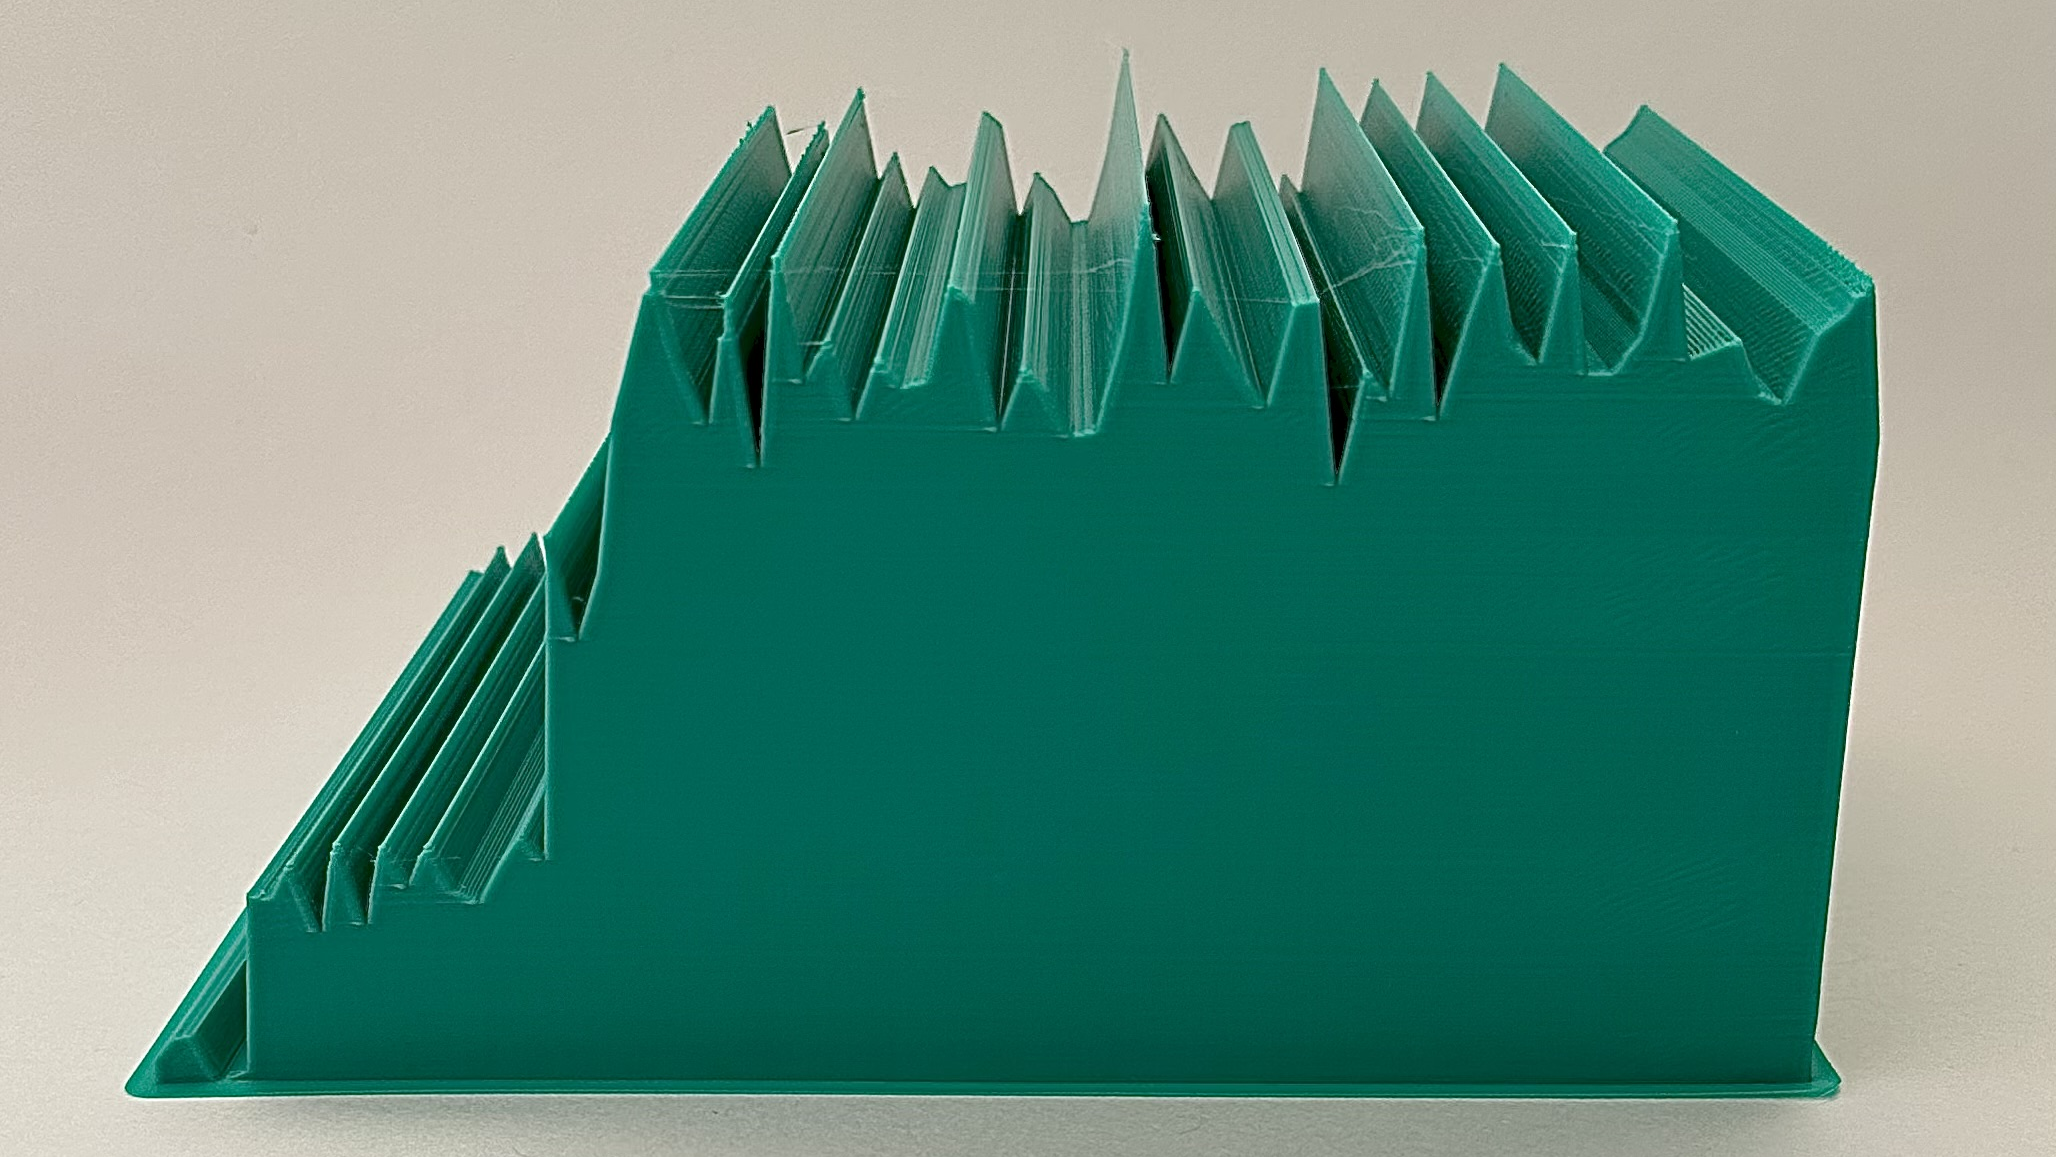
However, I couldn’t wrap the surfaces around my plot, so I manually started making them in Rhyno, I spent a couple of hours trying to get this figured out, and I’m not sure how I finally managed to get my form.
Conclusion
Overall, I like the way my data plots came out; however, I’m not too sure about how the sizes of my pieces came out. I wish my small piece came out bigger and I wish my green big piece came out smaller. I still have to find the right scaling for my prints. For the green one, I especially wish I got the scaling right because I feel I consumed a lot of filament. I also feel as if I should start messing with the infill percentages.
Hi Nathanial, good job on your data physicalizations! I liked all three data sets that you picked. I think the government salary data was really interesting, and I completely understand why you decided to randomize the order of the bar graph to make a more interesting form. However, I wonder if there was something else you could add to your form to help the viewer understand the meaning of the data. I don’t know exactly what this would be, but I think it would be cool if there was some way to know what salary was associated with what job just from the object.
Hi Camila,
You’re right, I wasn’t really sure what would’ve been the way to represent the salary data. I also blame that I didn’t have much time to work on this one as I wanted to switch to the next object. Thanks
Hello Nathanial, I really enjoyed seeing your vessels in class. I really enjoyed you green vessel and how it represents the lottery data from New York. I really liked your though process about how to clean and organize the data. I could just imagine a vessel that represents the whole U.S.A. If you wanted a simple way to scale your objects, cura has a scaling feature. That’s what I had to do, because my vessels were larger than the actual printer when I imported the .stl file into cura. Great Work!
Hi Atah,
Thanks for your comment. Yeah, the green vessel was quite unexpectedly big, I have to make sure I get the scaling correct next time. Thank you for your suggestion.
For the graph type in your green model, I found it easier flip the model on the side so that the points didn’t get all mushy as it got higher in the z-axis. The settings that have worked best for me is an infill of about 20 to 25%, but increase the number of walls and outside layers to four. That gives you a nice sturdy model without too much infill/filament usage.