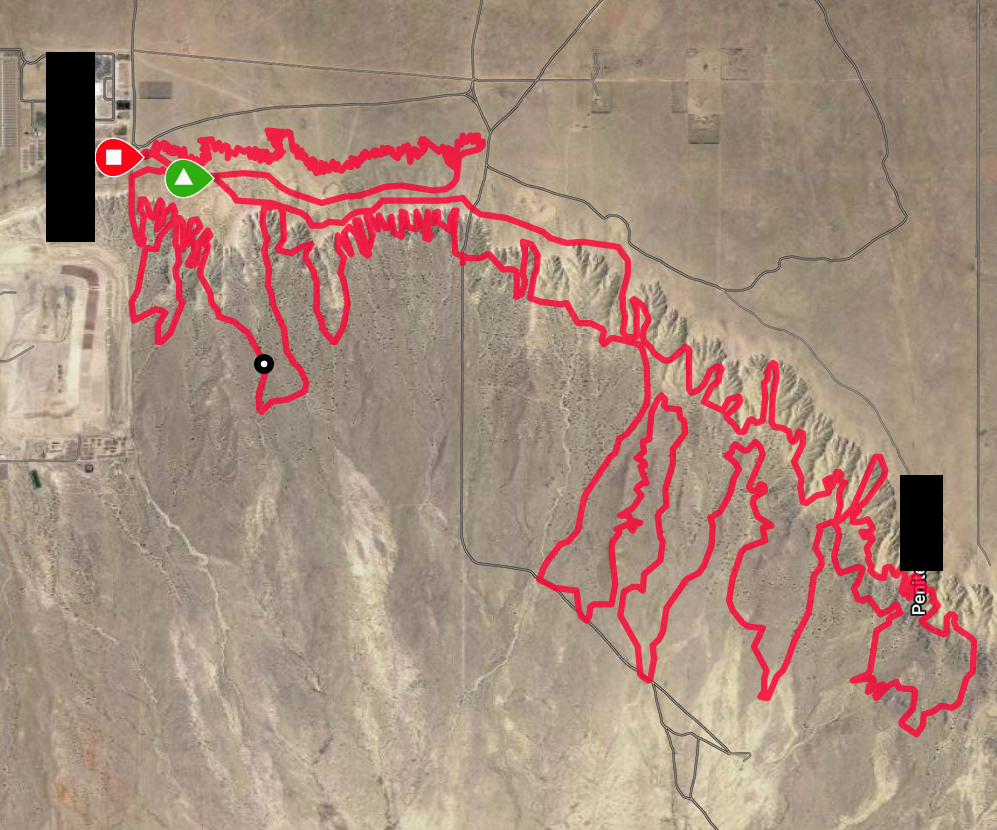
My final project is to take the GPS data from my weekly dirtbike rides and print it. Showing the difference of elevation and the track map. I intend for one print to cover the entire track, although I may print a few individual sections for more detail. The watch I use also provides information on body temperature, heart rate, and speed which may also be interesting to plot out (instead of elevation at each point, I could print out my heart rate with the map, showing exactly where on the track I am hitting my highest/lowest BPM.
Deliverables:
– Print a map of the track we ride, including elevation/height
– Print a map of the track, with speed instead of elevation
– Print out smaller sections of the track to view data more precisely
Here is a timeline I intend to follow:
November 2: Find a way to convert the GPX data that I have to a usable filetype or dataset
November 9: The GPX data is all in latitude/longitude coordinates. I want to convert those coordinates to another coordinate system I can use.
November 16: Tracing out the shape may be difficult, I intend to spend this week figuring out how to create a printable shape with walls and a base. Run the first print.
November 30: Use other pieces of data that are collected to change the print (heart rate, speed, temperature) continue to dial in printer settings to get the most detail in each print.
I have also found a company that does exactly what I am intending to do with this project, but they do give details to their exact process: https://wayzada.com/pages/about-wayzada
Hello Andy, I think being able to visualize your bpm during your rides would be really cool. I also can’t wait to see your process on how you decided to to convert the GPX data into rhino and create the maps. Good Luck with your project, can’t wait to see it!
I’m also very excited to see the BPM change during the rides. I have a good idea where my heartrate spikes and dips, but it will be super cool to visualize.
What a great idea to use your own data and making an object out of it. I like that you have the maps of the routes you’ve taken and will be able to implement that into your project.
I’m glad you like the idea, I’ve had this fitness/gps watch for a couple of years now, and I’m super excited to be able to actually view a 3d model of the different trails I ride!
Hi Andy, Your final project idea is super cool! Printing out your dirtbike ride GPS data with elevation changes and a track map sounds like an awesome way to document your adventures. Adding your heart rate, body temperature, and speed info to the mix makes it even more interesting. It’ll be fun to see where your heart rate spikes and drops along the track. Printing out sections for more detail is a great idea. Can’t wait to see the finished project!
I’m glad you like the idea! I’m really excited to see the heart rate spikes across the track too. I have a good idea where my heartrate spikes and dips, but to visualize it in greater detail should hopefully turn out really cool!