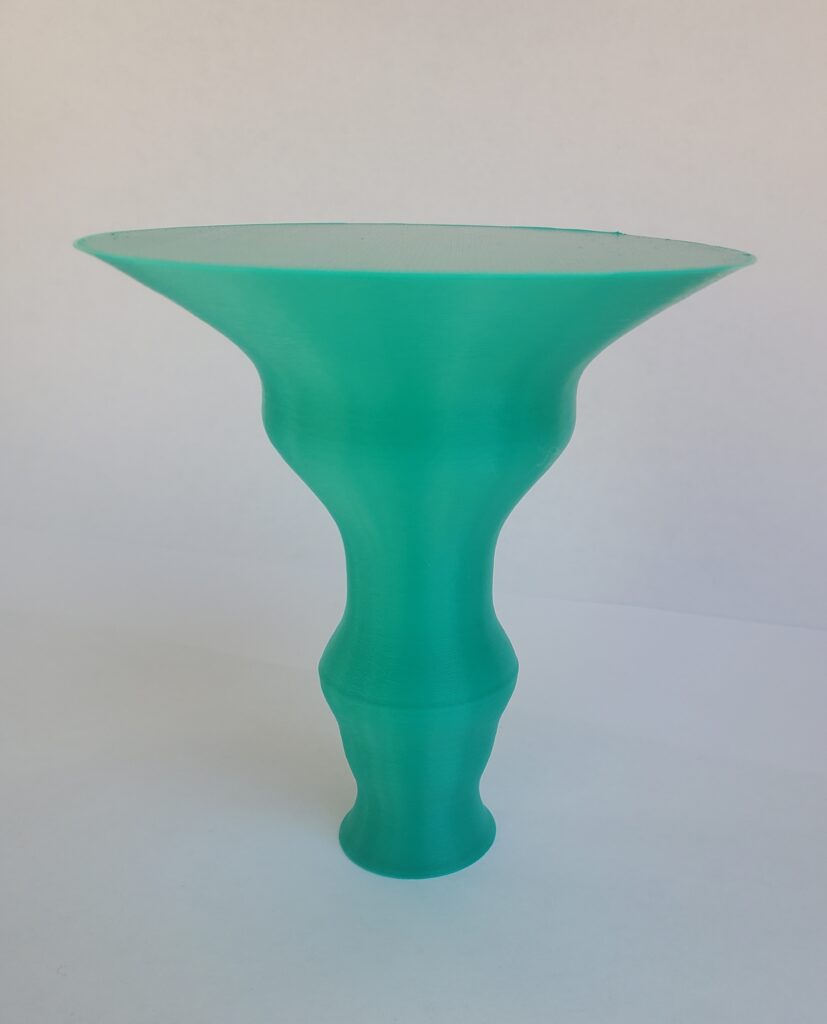
My sister has become a big birder over the last few years and she’s gotten me into it a bit, so the first data set I chose was from Audubon’s Christmas bird count. Their database is huge and really easy to choose what information you’re looking for. My favorite bird is the Norther Flicker, its from the woodpecker family, so I looked up data for Northern Flicker in New Mexico. There was more data than I needed in the CSV they provide when you download data so I took the columns for year and the number of sightings. My assumption is this data is more telling on how many more people are participating and using Audubon than an increase in flicker population in NM but I think the data is pretty interesting regardless.
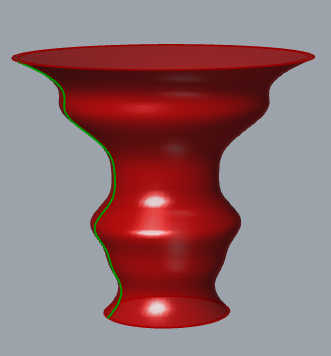
For my second dataset I wanted to find a way to turn a piece of music into data. I did some research on if and how anyone had done this before and found that you can use MIDI files to get integer numbers for notes. I had Bach’s Violin Partita 3 in mind and was able to find a free MIDI file for this piece. I did have to write a short python program to read the midi file and get the values of each note. There is a python library called mido that makes it possible to read a midi file and its data. MIDI files give musical notes from 0 – 127 which works perfectly for building the data. I was originally planning on getting the average note value from each measure but that turned out to be pretty difficult as the midi file doesn’t keep track of measure or what type of note it is(quarter, eighth etc). I didn’t realize this right away so I was under the impression that I was getting measure averages until after I began printing my object and actually thought about the number of rows in my data compared to the number of measures in the piece, whoops… So my program actually takes groups of notes and gives their average value my vessel object is using groups of 4 notes. And adds the average to a CSV. The data for this piece had about 800 rows which was way too much to do in one vessel so I played around with the range and settled on 100 data points from note groups 100-200.

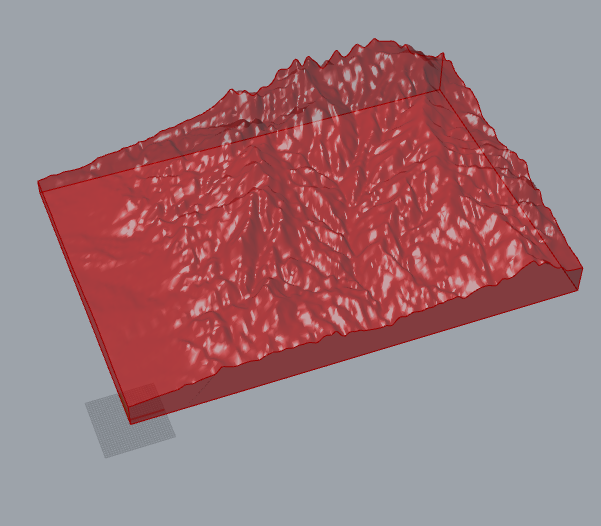
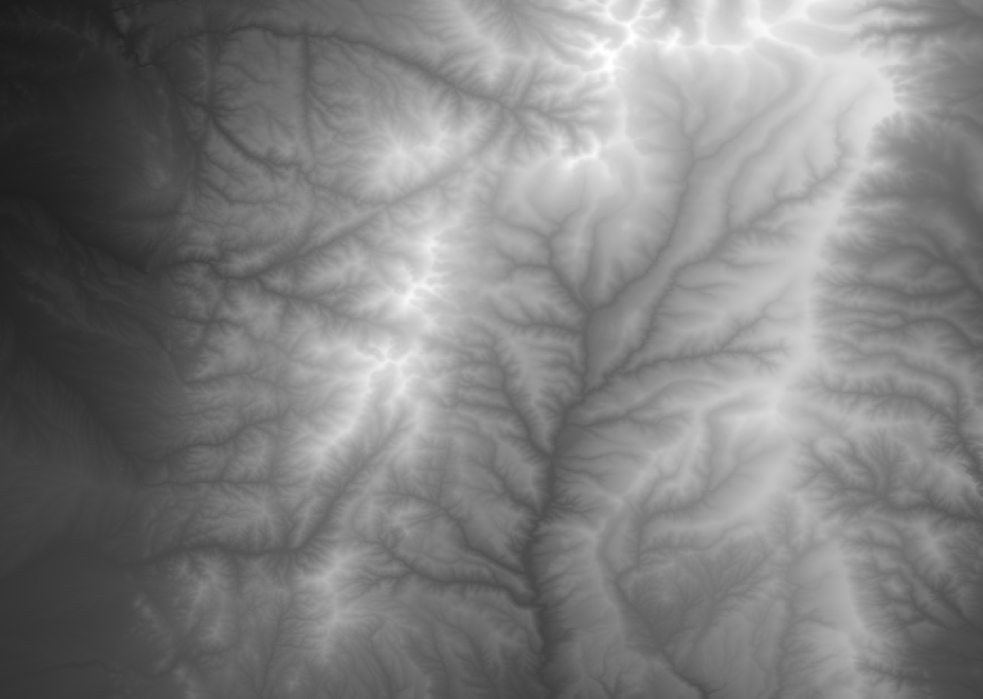
My last piece is from what we did in class I really liked the idea of printing out a mountain range from the elevation data. There is a hike that I do a few times a year with my family in the Santa Fe ski area up to Nambe lake and I was able to find the topo data for the area around where the trail is and used the same process we did in class to construct it.

I found designing with data very interesting. There is so much data out there that the possibilities are endless. Using the bitmap of terrain is such a cool thing I want to try to do more with it with buildings and other data. Being able to visualize the data in a different way is really cool too we’re so used to charts and graph that its pretty cool to see the data take some tangible form. I enjoyed figuring out the music vessel I made and plan to play with that idea some more to see if I can get it to work the way I had originally planned. I added the python code I used to convert the midi file to csv in my zip file if anyone is interested in using it!
MIDI Source: http://www.jsbach.net/midi/midi_solo_violin.html
Code/data: https://handandmachine.org/classes/computational_fabrication/wp-content/uploads/2023/10/MichelRobertLA3.zip
Hey Michel! I really love your pieces and the variety of data you chose to represent. I just recently heard about the Audubon Christmas count so it was cool to see some of that data. I especially loved that you chose to try to represent music as well. I love Baroque music (casually, not enough yet to know what song that is) so I will definitely listen to the piece and I think it would be fun to try to figure out where that section is, even though it’s grouped by notes rather than measures. That sounds like a really cool library, I will have to check it out as well as your code so thank you for sharing! I love the Santa Fe Ski Area during all times of the year, and the Nambe Lake hike is so magical so I also really appreciate the map – especially how beautifully the topo layers came out in the print – they look so fluid! And I agree that the tangible-ness of the data is really special and fun to explore!
Hi Michel!
I really really love and appreciate your work on your forms, particularly your representation of music. Your solution to such a non trivial question is pretty ingenious, and I think it turned out fantastic because of it! I wonder if you could’ve potentially taken the wave form of the music akin to how we did the plot revolution as well, though maybe this wouldn’t have come out as nice. I think the ability to visualize data using a bitmap is also very interesting for an extra dimension (perhaps an additional parameter for your musical decomposition!) Great job with this!
Hello Michel,
I never would have thought to use a piece of music for this project. Because not only is it converting data into a physical art piece, but it’s taking an addition step in representing something that’s traditionally a heard art piece. Also if I am remembering from class correctly you figured out the problem with the bitmap being out of memory and that was to just use a different file type, what was that type again?
Hi Lasair,
The file type i used was .bmp instead of .pmb. The file didn’t show up even including the file type when I tried to load it into the program so i had to show all files and pick it from there! Hope you can get it to work too!