Introduction
For this project, Alan and extracted and utilized data collected from the UNM Olympic , Johnson, and Therapy pools. We both work as lifeguards there, and we thought it would be really interesting and beneficial. Specifically, the data we will be focusing on will be the PH, ORP (Oxidation Reduction Protentional) , Temperature, and Water Flow. Additionally, the ph level in the water determines the color. If ph of water is below 7.2 or above 7.8, the color of the shape is a clear filament. Otherwise it will remain blue.
Background Research
For our primary inspiration of this project, we were both inspired by this article ” Opportunities and Challenges for Data Physicalization” by Yvonne Jansen, Pierre Dragicevic, Petra Isenberg, Jason Alexander, Abhijit Karnik, Johan Kildal, Sriram Subramanian, and Kasper Hornbæk. This academic article delves into the benefits and opportunities offered by data physicalization, such as offering an intuitive and memorable way to model data that might otherwise might be too confusing or not engaging enough to properly understand. This is certainly the case for our project as well. The various measurements we are looking at in the pool, PH, ORP (Oxidation Reduction Protentional) , Temperature, and Water Flow quite simply just seem like numbers to the everyday viewer, but with the help of a model, especially a 3d physicalized model, it truly brings the data to life and much easier to comprehend and significantly more engaging and accessible.
The second academic recourse we used was the various water data physicalisations / visualizations from the United States Geological Survey (USGS). On this site there a lot of really interesting and insightful visualizations on topics about water ranging from unequal access to water to a map of the drought in California. In particular , one data model that we found especially interesting and relevant was the “Gages Through the Ages” model. The USGS made an interesting and accessible visual representation of this water data through chronological time stamps and similarly in our project to visualize PH, ORP (Oxidation Reduction Protentional) , Temperature, and Water Flow , we will be using chronological time stamps as well (likely daily). In both cases , of both our project and the USGS “Gages Through the Ages” model , the data is used to improve water quality / recourses while in our project the data we model / measure is also used to improve water quality / recourses while also helping ensure a safer swimming environment for patrons.
As far as our artistic inspiration, we were inspired by both of these pieces in particular. The first one by Herschel Shapiro we both found very inspiring due to the use of various shades of blue / purple and the incorporation of different filament colors, this is something we are both really wanting to implement in our project. Additionally, the use of the swirl pattern / texture was really appealing to us as well. The second design project (linked below) we also found very inspiring to us. In this one , we found the concept of 3d printing masonry to be very applicable since it is essentially a form of wall art in a way as well. Additionally, we found their design and printing process to be very organized. In their process , they first designed a computationally symmetric and cohesive 3d model and then began testing different scaled mockups, we plan to follow a similar plan on testing smaller scale mockups before committing to our final , large print.
https://labs.waterdata.usgs.gov/visualizations/index.html#

Credit : Herschel Shapiro
https://herschelshapiro.com/maelstrom

Process
1 ) Extracted Data from CSV file of pool water Data using python. Data Focused on Length, Radius, ORP (Oxidation Reduction Potetnial), and ph .
2) Formulated cylinder like models defined by the data.
3) Created Grasshopper script that generated one model for each collection point
4) Experimented with printing different sizes of models.
5) Created Tiling Bases for the models to be interconnected.
6 ) Final print – Due to the amount / size of our overall print we had to print in large batches. Challenge – we underestimated the final time.
Length: Is defined by the flow of water from each pool
Radius: Is defined by the temperature of the water from each pool
Bend: Is defined by the ORP (Oxidation Reduction Potential)
ph: If ph of water is below 7.2 or above 7.8, will determine the color of the shape
We designed cylinders and cones to represent data visually, creating sets of three to compare data from different sources (Olympic, Johnson, Therapy) over time. These shapes allowed us to highlight differences effectively.
To make the visualization more appealing and easier to interpret, we placed the shapes in a grid format with even spacing, ensuring a clean and professional layout.
We reused elements from a previous tiling project to create a consistent base. Using Boolean Union, we combined the base with the data shapes, ensuring structural integrity and alignment.

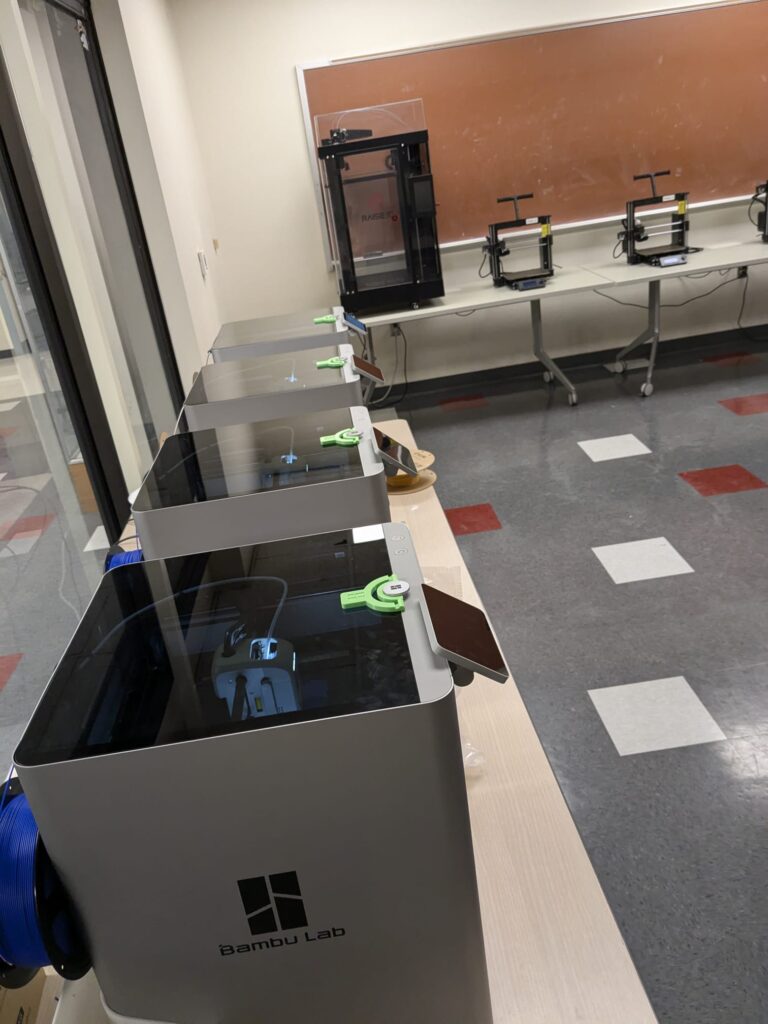
We used both Alan’s Ender 3 printer and the Bambuu printers in the mechanical building, with PLA as the material due to its accessibility and ease of printing. The printers allowed us to achieve precise and durable outputs. The bambuu printers were especially fast and exceptional for batch printing as well.

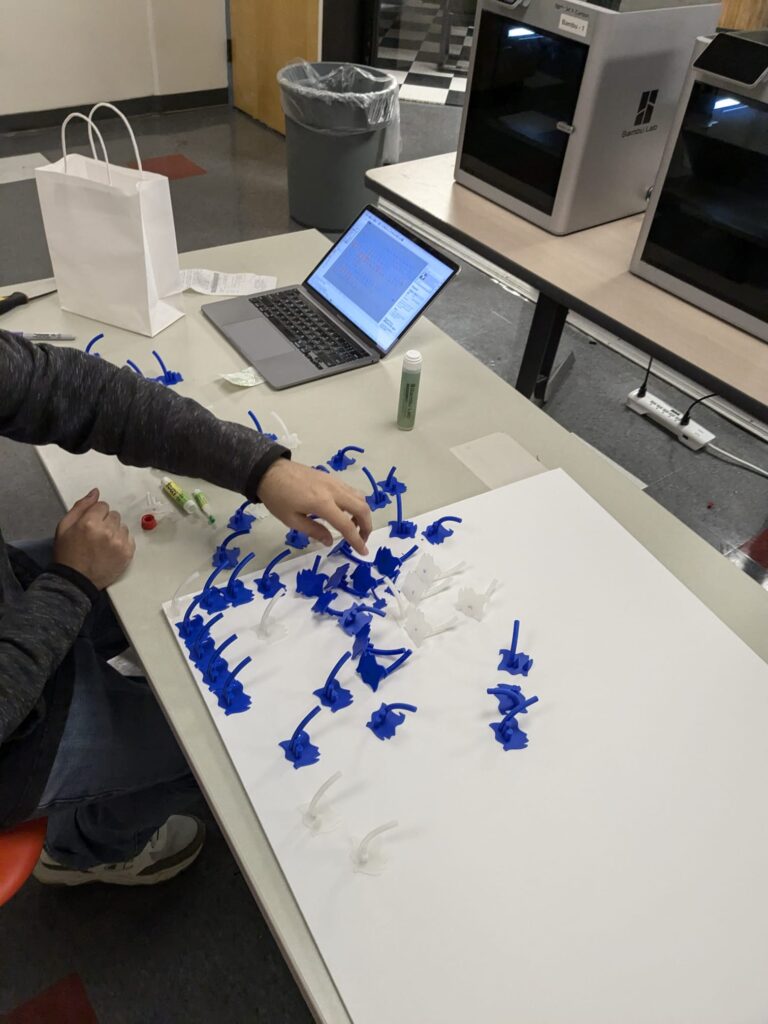
We used two PLA colors—blue and clear —to indicate pH levels. Blue signifies a safe pH range, while clear indicates levels that are too high or low, providing a clear visual cue for safety.
After we had printed a majority of our tiling objects , we then began assembling them on the foam board platform that we bought from the UNM bookstore. Alan developed a really good numbering system / book keeping system to keep track of the positions of each object and the order in which it was printed etc using a clone grasshopper grid with his tiling to represent the indexes as we printed. Additionally, we utilized a number and grid system to keep track of where the objects should be placed relevant to the other shapes. Following this methodology, we were then able to have a smooth and organized process when printing and then gluing down to the board.

Challenges
As far as challenges , some difficult things for us was spacing the objects evenly, laying them out nicely in a grid, and printing in a timely fashion. Additionally, there were a lot of mechanical engineering students who also really needed to use the 3d printing lab at the time of our printing, so we had to time our prints well and be very patient with the other students in the lab at the time.
Outcome

Alan and I were very happy with how everything came to life . The bambuu printers did a great job of batch printing everything and bringing our original idea to life. Looking at these results in person it is definitely really interesting to see how these data sets we measured came to life, one statistic in particular is the Ph anomalies (outside of the desirable range) which happen quite frequently, it would be really interesting to further look into this and see if there are any significant correlations with seasons or other activities in the various pools affecting PH levels.
Future Work:
If we had additional time on this particular project, it would be really cool to continue to add more colors in for more measurements in the data. It would be also really cool to continue to add further modifications to each individual shape in our grid defined by even more parameters in the data than we even did. Additionally , as far as continuing our pool monitoring data research, it would be really beneficial and cool to perhaps make a 3d printed fully downsized , to scale model of each pool at UNM. It would also be really interesting to make a 3d printed data representation of the 3 pools population data to see when are the most popular times to visit the pool, because our boss does track and keep this information, perhaps this could be incorporated with the idea of the replica scaled down models.
Reflection
Alan: This project was very interesting for me. Being able to choose what to focus on for your project is motivating. If I were to do this project again, I would like to include more data to be represented, such as incorporating rotations for the objects or using a different shape to represent zeros. Additionally, I would have liked to make the prints a bit bigger. I am most definitely going to try to hang this.
Ian: This project was really interesting to me as well. I really enjoyed being able to take real data from the Johnson pools and turn it into a 3d model. I think the most challenging part for me was figuring out how to print so many models in a timely fashion.