Progress
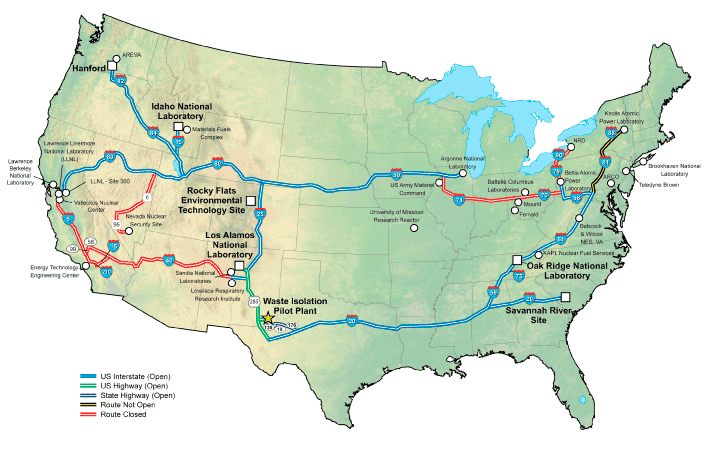
Perhaps unsurprisingly, it has been a bit tricky to find detailed information about the nuclear waste stored at the Waste Isolation Pilot Plant (WIPP). I believe this is because it stores transuranic waste, which is primarily produced in the development of nuclear weapons. Still, I was able to find some data sets which I plan to develop into three different models, as shown below.
Datasets:
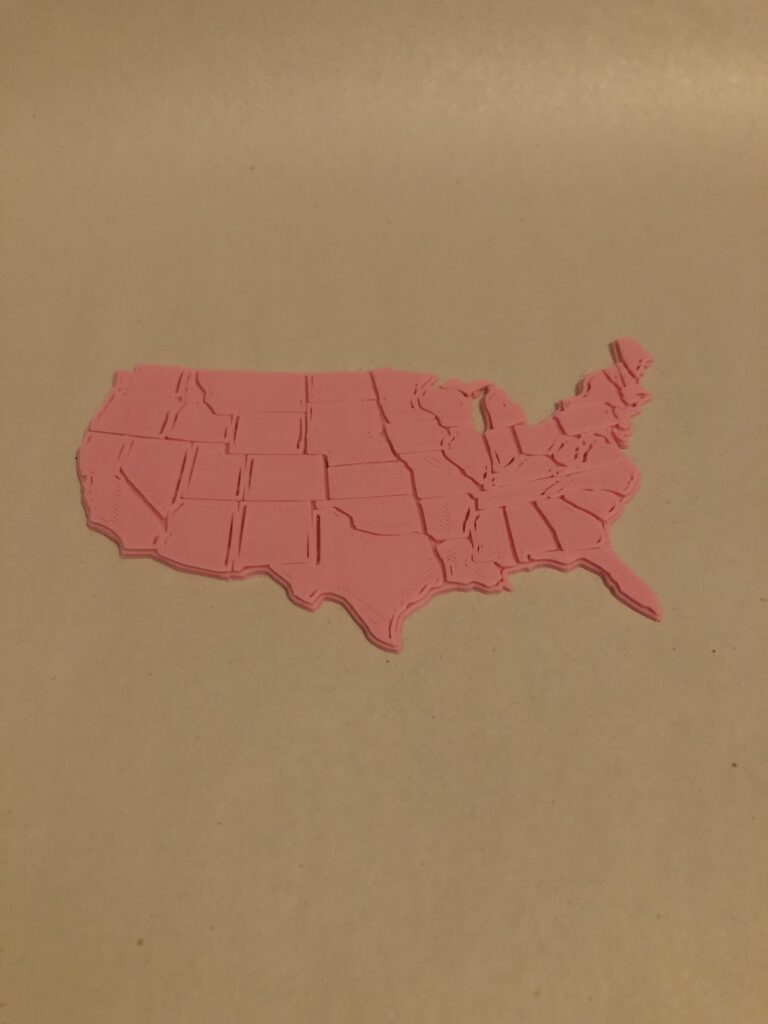
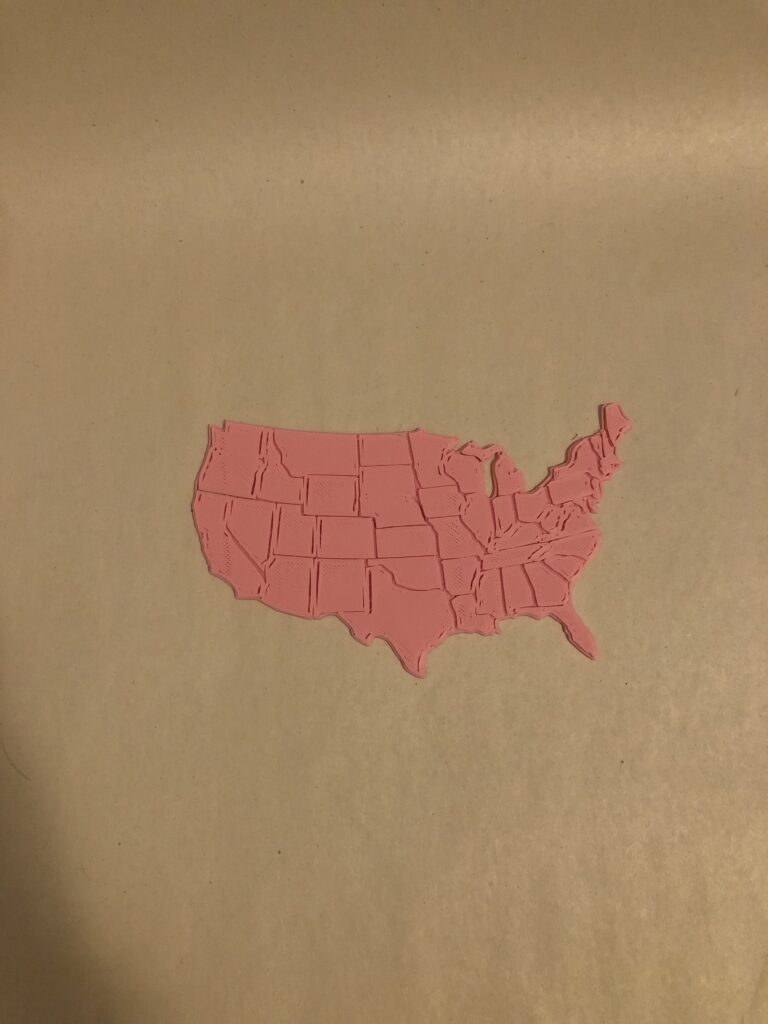
- WIPP Transportation Route and Shipment Information: The map is published on the WIPP website, along with the amount of shipments from each source. For the printed prototype, I used a Rhino library called Vectorize to generate vectors from an input image. I then used the curves to generate Planar Surfaces and created individual surfaces for each of the states. Altogether, I was able to print a map of the USA.


2. Timeline of radiation exposure using radiation symbol: For this model, I plan to calculate the level of radiation from the WIPP waste and model it in the shape of the radiation symbol. The purpose behind this model is to show how long the danger of this waste lasts.

3. Storage Container Information: Finally, for this third model, I have begun designing a model of the TRUPACT-II storage container which is transported to WIPP. I would like to show how much waste is being produced and shipped in a more intuitive way.

Updated Timeline and Milestones
By November 13th: Explore public datasets related to the WIPP project and decide what kind of representation(s) I want to create
By November 27th: Prototype the base using the Ender 3D printer
By December 4th: Computationally design a model for the dataset and prototype using a novel fabrication technique
By December 9th: Develop the final model
Finals Week: Present
Updated Deliverables
- Datasets related to nuclear waste: map of WIPP transportation routes, timeline of radiation exposure levels, and WIPP storage container information
- Computational models of the datasets that clearly communicate important aspects of the data:
- The map will show the WIPP transportation routes with topology based on the amount of shipments that have been sent along each interstate
- Timeline will demonstrate the longevity of the waste (scaled in log time) based on the form of the radioactive waste symbol
- Storage container models will allow us to visualize how much waste is shipped and stored at WIPP
- Physical model(s) of the data that cohesively tell a story about the dangers of nuclear waste
- Map: base map of USA with states outlined (shown above). Topology will be in a separate layer that can be visualized on top of the base map.
- Timeline: will be printed in black and yellow
- Storage containers: printed using a different material (ideally soft metal)
- Presentation with the models