Heart Rate (BPM) During Sleep – 3 hours 21 minutes
- Dataset Link: Motion and heart rate from a wrist-worn wearable and labeled sleep from polysomnography v1.0.0 (physionet.org)
- Why this dataset: I chose this dataset because it provides insights into heart rate patterns during sleep, a critical period for physical and mental recovery. Understanding how heart rate behaves during different sleep stages (such as deep sleep and REM sleep) adds depth to the overall project. By comparing heart rates during sleep with those during exercise and exam stress, I can explore how the body’s physiological responses vary in states of rest versus heightened activity or stress. This dataset forms a key part of the overall set, allowing me to visualize how the heart functions in a calm, resting state versus other more demanding scenarios.
- Data cleaning/filtering:
For the sleep dataset, I focused on the heart rate data found in the “heart_rate” folder, which contained 31 individual text files—each representing the heart rate readings of a different participant. To clean this data, the first step was to convert all 31 text files into CSV format. Since I am primarily interested in heart rate patterns, I filtered out the unnecessary columns and kept only the heart rate column from each file, discarding the time information.
Once I had cleaned the individual heart rate data for each participant, I performed an additional step of averaging the heart rates across all participants. This allowed me to create a single, consolidated CSV file representing the average heart rate during sleep for the entire group. This averaged dataset provides a clearer view of the general trends in heart rate during sleep, simplifying the analysis and visualization for the project.
Using this cleaned data, I created two 3D forms: one based on the average heart rate of all participants, and another based on the heart rate data of a specific participant that I found particularly interesting. These two forms offer a comparative perspective, showcasing both the general trends in heart rate during sleep and an individual variation that stands out.
Heart Rate (BPM) During Exercise (Treadmill Maximal Graded Exercise Tests) – 4 hours 22 minutes
- Dataset Link: Treadmill Maximal Exercise Tests from the Exercise Physiology and Human Performance Lab of the University of Malaga v1.0.1 (physionet.org)
- Why this dataset: I chose this dataset because exercise provides a well-understood scenario of elevated heart rate, which acts as a useful contrast to heart rate during sleep and exam stress. Maximal exercise tests offer a clear representation of how the body responds to physical exertion, providing data at the upper extremes of cardiovascular activity. By comparing heart rates during intense exercise to those during sleep and exam conditions, I can highlight the variability in heart rate between physical exertion, stress, and relaxation, emphasizing how each scenario affects the body’s physiology in distinct ways.
- Data cleaning/filtering:
The exercise dataset came as a single CSV file containing the data for all participants, with nine columns: Time, Speed, HR (Heart Rate), V02, VC02, RR, VE, ID_test, and ID. To clean the data and analyze it on a per-participant basis, I separated the data by participant using the unique ID for each. This resulted in around 860 different files, each containing the data for a specific participant.
For each participant, I kept only the columns relevant to this project: Speed, HeartRate, and their ID. This allowed me to focus specifically on the relationship between heart rate and speed during exercise, which is the key metric for this dataset.
Additionally, I performed another round of data cleaning by averaging the heart rate data across all participants. This gave me a single CSV file representing the average heart rate during exercise, which simplifies the visualization and provides a generalized view of how heart rate responds to increasing speed during treadmill tests.
Using this cleaned data, I created two 3D forms: one based on the average heart rate of all participants, and another based on the heart rate data of a specific participant that I found particularly interesting. These two forms offer a comparative perspective, showcasing both the general trends in heart rate during sleep and an individual variation that stands out.
Heart Rate (BPM) During Exam Stress (Midterm 1) – 2 hours 52 minutes
- Dataset Link: A Wearable Exam Stress Dataset for Predicting Cognitive Performance in Real-World Settings v1.0.0 (physionet.org)
- Why this dataset: I chose this dataset because it highlights the physiological effects of stress in a real-world scenario that many people can relate to—taking an exam. Exam stress is a common experience, and it often leads to increased heart rates due to anxiety and cognitive pressure. This dataset allows me to compare the body’s reaction to mental stress against both the calm of sleep and the physical exertion of exercise. Together with the other datasets, it forms a comprehensive set that illustrates how different kinds of stress—physical, mental, and emotional—affect heart rate.
- Data cleaning/filtering:
Upon downloading the dataset, I found a zip file containing folders for 10 students (labeled S1 through S10), with each student having three subfolders: Final, Midterm 1, and Midterm 2. Within the Midterm 1 folder, there were seven CSV files for each student, including ACC, BVP, EDA, HR (Heart Rate), IBI, tags, and TEMP. Since my focus was solely on heart rate data, I extracted the HR CSV files for each student specifically from the Midterm 1 folder.
This process allowed me to compile the heart rate data for each participant during the 1.5-hour exam period. I chose to analyze Midterm 1 because I believe students are likely to experience heightened anxiety during their first exam in a course. They are unfamiliar with the exam setup and have not yet practiced taking the exam, which could result in more interesting and significant heart rate data.
In addition to compiling the individual heart rate data, I also averaged the heart rates across all participants to create a single CSV file representing the average heart rate during the Midterm 1 exam. This averaged dataset helps to highlight general trends in physiological responses to exam stress, providing a clearer perspective for analysis and visualization.
Using this cleaned data, I created two 3D forms: one based on the average heart rate of all participants, and another based on the heart rate data of a specific participant that I found particularly interesting. These two forms offer a comparative perspective, showcasing both the general trends in heart rate during sleep and an individual variation that stands out.
Why These Datasets Form a Cohesive Collection
The datasets I selected—heart rate during sleep, exercise, and exam stress—work well together because they represent a spectrum of physiological responses under different conditions: rest, physical exertion, and mental stress. Each dataset offers a distinct perspective on how the heart reacts to varying states of the human body, ranging from the calm of sleep to the intensity of exercise and the anxiety of test-taking. Together, they form a comprehensive picture of how heart rate fluctuates in response to both physical and psychological factors.
By visualizing these datasets through 3D prints, I aim to create a collection of physical forms that highlight these contrasts. Each print will embody the unique patterns of heart rate data from these different scenarios, but when viewed as a set, they will reveal how interconnected and dynamic the human cardiovascular system is across a wide range of activities. The collection helps viewers grasp the relationships between rest, physical stress, and mental stress, making the abstract data more tangible and easier to interpret.
In summary, the datasets complement each other by covering diverse yet interrelated aspects of heart rate variability. The 3D-printed forms will reflect these physiological differences, and as a cohesive set, they will provide a broader understanding of how the heart functions in daily life under various conditions.
In my design process, I used the cleaned and averaged heart rate data from each dataset to generate 3D forms that visually represent patterns in heart rate across different scenarios: sleep, exercise, and exam stress. I chose to create two forms for each dataset—one based on the average heart rate of all participants and one based on a specific participant whose data stood out. This allowed for both a general overview and a more focused exploration of individual variation. Each form was generated by converting the heart rate data into a continuous 3D shape using heart curves, with the radius of the form corresponding to heart rate values over time.
These forms illuminate how the heart’s activity differs during rest, physical exertion, and mental stress, teaching me about the varying intensities of physiological responses across these conditions. The comparison between forms also highlights the significant contrasts between sleep, where heart rate tends to be stable and lower, and more stressful conditions like exams and exercise, where heart rate spikes are frequent.
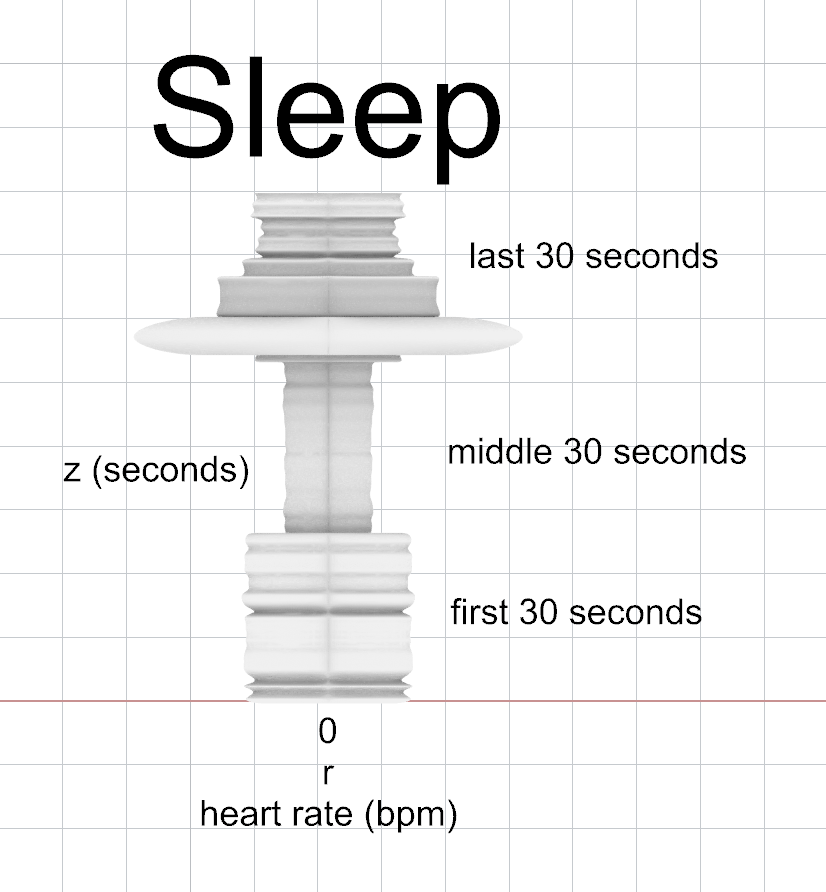
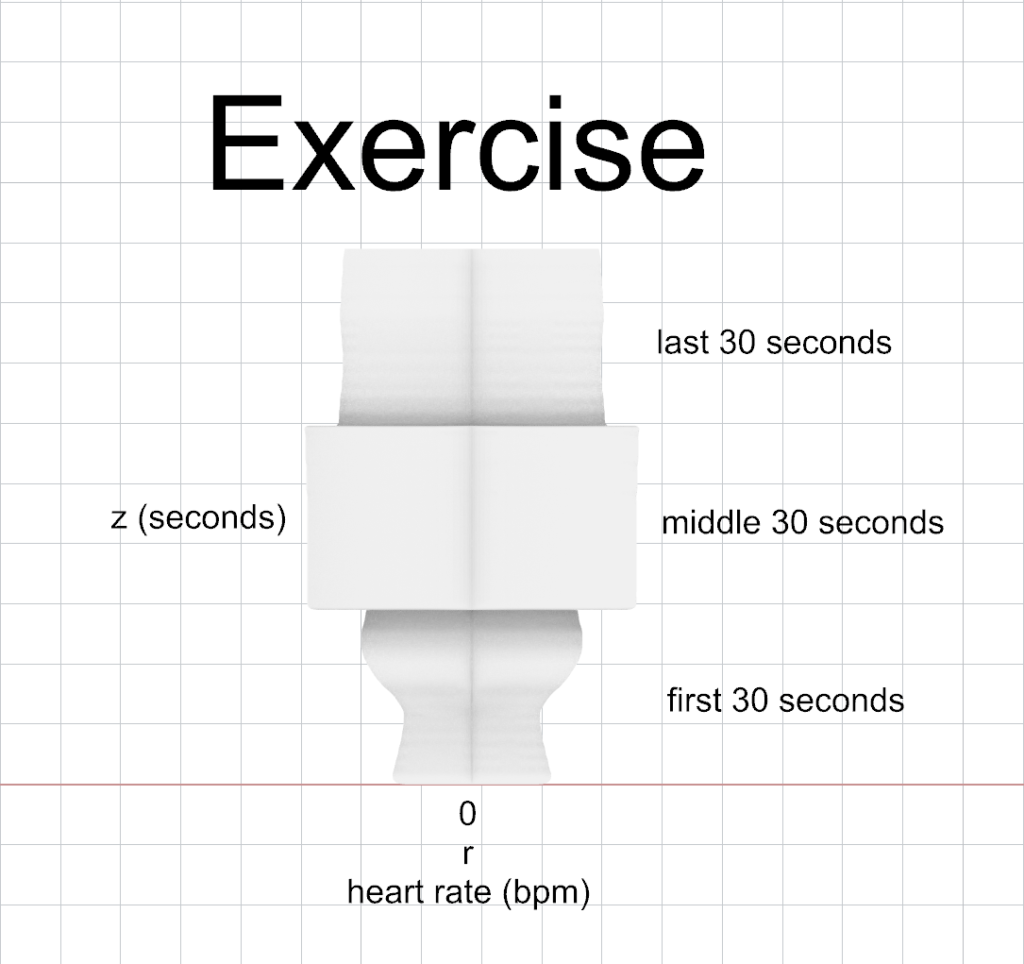
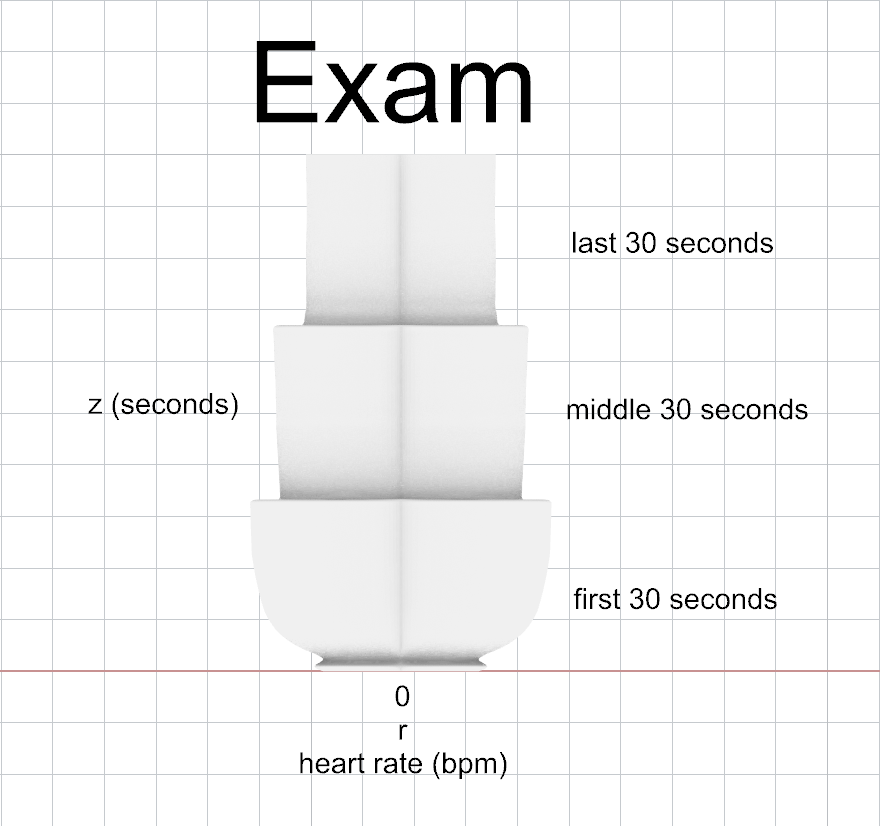
Final Forms
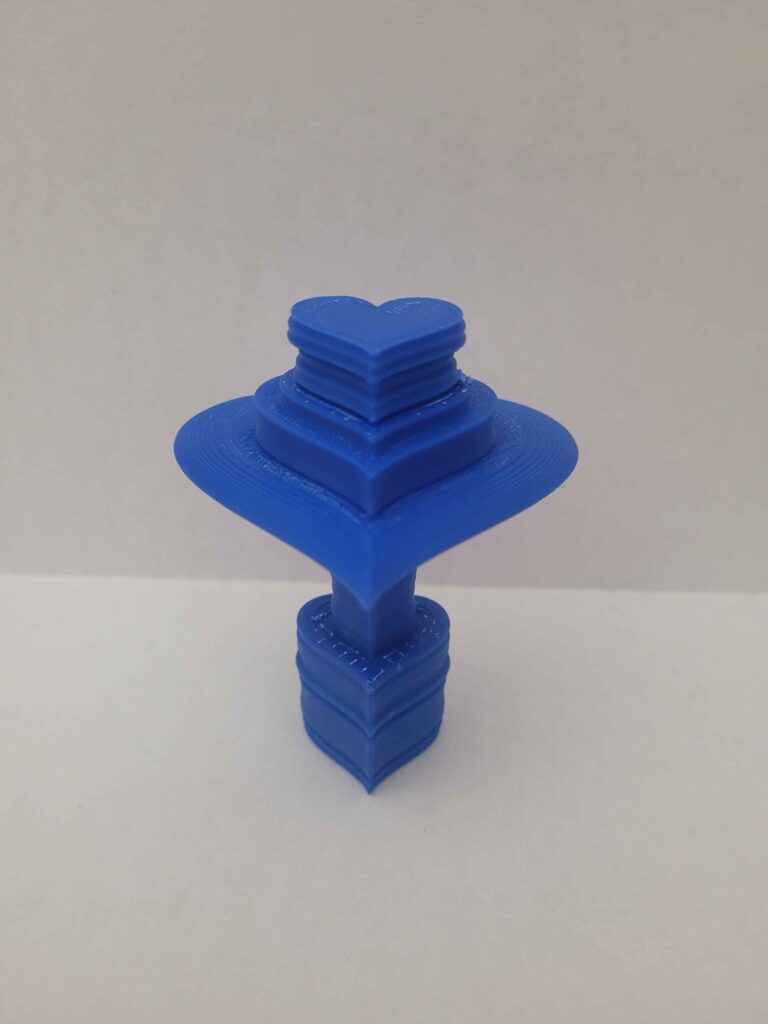
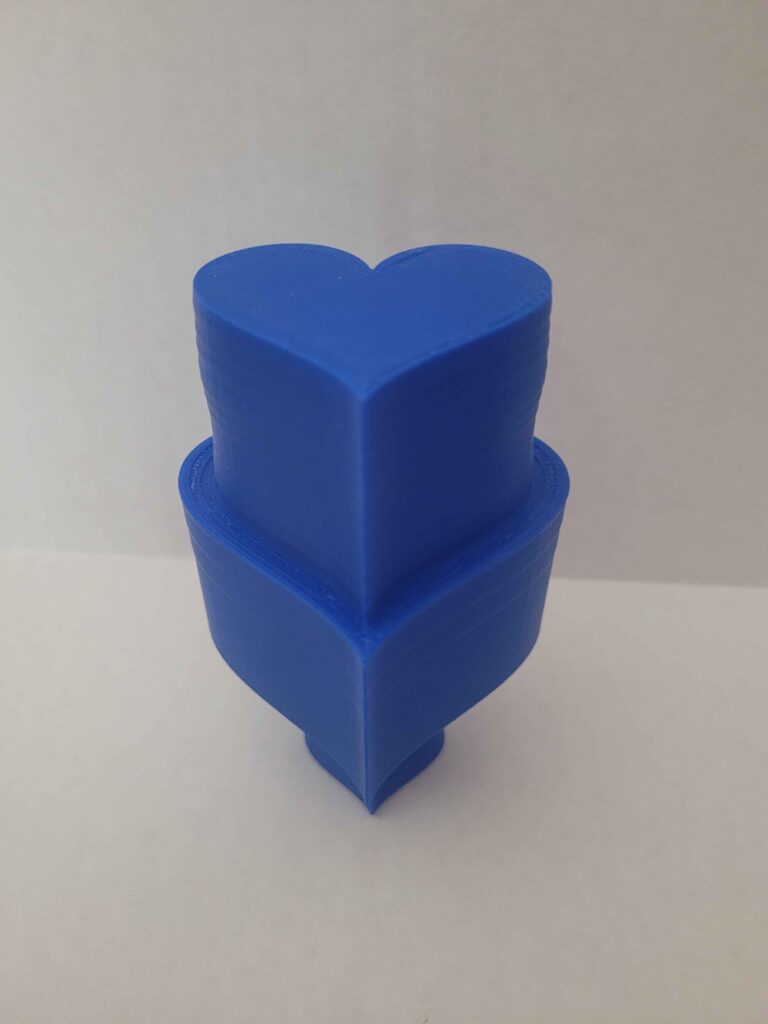
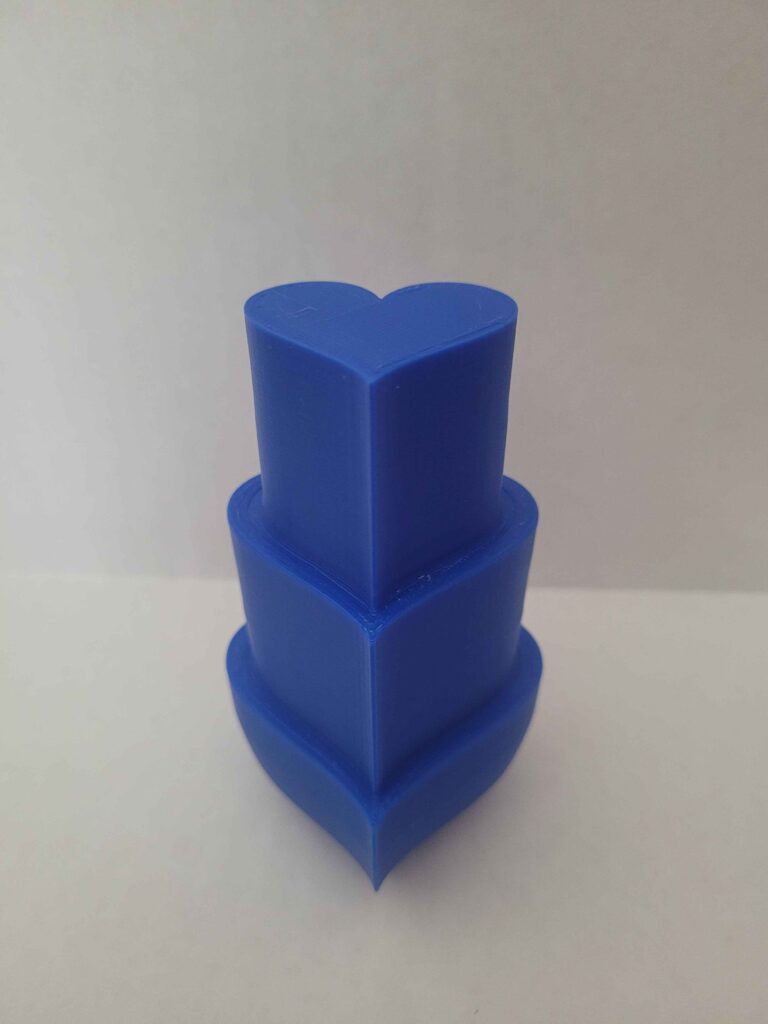
Reflection on Data Physicalization
I think that designing with data through 3D objects helps me create physical representations of complex information, making it easier to understand. By comparing the heart rate data of students under exam stress with that of people sleeping, I can visualize the differences in physiological responses. This physicalization turns abstract data into tangible forms that I can analyze, manipulate, and share, revealing patterns that might not be obvious in traditional 2D formats like graphs or tables.
Creating these objects allows me to explore the data in a more engaging way. As I develop forms based on heart rate variations, I gain insights into how stress affects cognitive performance. These 3D artifacts visually demonstrate the relationship between stress and physiological responses, helping viewers quickly grasp the data’s significance. Additionally, the ability to physically interact with the forms—turning them or viewing them from different angles—adds an extra layer of understanding that enhances both the analysis and the communication of the data. Overall, with this approach deepens my understanding and makes the data more accessible and meaningful to others.
Hi, Daniel!
Great datasets and great prints! I really like how your prints are in a heart shape because it’s related to datasets! It’s very unique and also its easy to read the data from the 3D objects!
Regarding reflection, I agree with you that this kind of objects related to dataset are more engaging in a way! It feels more personal when you can touch and view them yourself. Overall, great job!
Hi, Bat!
Thank you so much for your kind words! I’m glad you found the heart-shaped design effective in connecting the data to the forms. My goal was to make the connection between the heart rate data and the physical forms as intuitive as possible, so I’m happy to hear it resonated!
I completely agree with your point about the tactile engagement. Being able to touch and interact with the data in 3D does make it feel more personal and real, which is something I aimed for in this project. And by looking at this data, it really shows you that taking an exam is just as or even worse than exercising. Thanks again for your feedback!
Hey Daniel,
This is one of the most creative and simple prints I’ve seen in this class. I think the heart is one of the few body parts you can do this type of print with. It would be hard to replicate similar results with data for another body part. Another great idea you could probably try some time is printing types of cardiograms with or on a heart-shaped graphic. Keep up the great work!
Hey Jyrus,
Thanks so much for your feedback! I’m really happy you found the design creative and clear. I agree, the heart lends itself well to this type of data visualization, especially when focusing on heart rate. It would definitely be a challenge to use a similar approach with other body parts, but that sounds like a fun idea to explore!
I love your suggestion about printing cardiograms on a heart-shaped graphic—that could add another layer of meaning to the visual. I did attempt this way, but I was having trouble with grasshopper agreeing with what I wanted so I decided to use a heart curve instead.
Hi dprairie2,
I really like your work! First of all, your data looks complicated and requires a lot of processing. Also, omg, I never thought that I could print objects based on the heart shape, it looks so cute and great, I really like the shape of your work.
In addition, I have been using Apple watch for 4 years, which also has a heart rate data recording function, and this function is great. Various visual data about heart rate can let me know the condition of my body, and I can adjust some schedules appropriately.