Introduction
For my final project, I wanted to implement a model of data related to the Waste Isolation Pilot Plant (WIPP) and nuclear waste around New Mexico. One project that Sandia Labs worked on relevant to WIPP was long-term nuclear waste warning messages. Because nuclear waste can last the order of magnitude of 10,000 years, it is essential that people today think about how to warn people of the future about the dangers of these waste sites. I hope to explore this question through my data physicalization to attempt to design a model that could communicate with people 10,000 years from now.
I chose to create two datasets from the WIPP website. The first was the WIPP transportation map which tracks the routes that highly radioactive nuclear waste is transported around the country and specifically into New Mexico. The second was the data on the different shipment containers that are transported to WIPP.
- Background Research: Describe how your project relates to previous work. Discuss the related work you have found and explain how it relates to or inspired your project. Include links, and (if applicable) images of the related work. Related work should be in the form of an original source. It can be an academic paper or thorough documentation of a designer’s or artist’s work. If you are a graduate student enrolled in CS591 your related work must include two or more academic papers.
Djavaherpour, H., Samavati, F., Mahdavi-Amiri, A., Yazdanbakhsh, F., Huron, S., Levy, R., Jansen, Y. and Oehlberg, L. (2021), Data to Physicalization: A Survey of the Physical Rendering Process. Computer Graphics Forum, 40: 569-598. https://doi-org.libproxy.unm.edu/10.1111/cgf.14330
This work examines the process of data physicalization and categorizes different methods of physicalization. It provides several examples of completed projects as shown below, including topological maps that will be relevant to my project. It details different datasets and methods for fabrication that designers use. The examples also gave me some ideas for how to fabricate my project as I am interested to explore techniques outside of the small plastic printer I have been using.


Source 2: Bringing Data to Life: Community Data Physicalization
This source discusses how to use community engagement as part of data physicalization. It focuses on the interactions of people with the data and how the process of data physicalization can provide opportunities for people to engage with data in public spaces such as museums, lobbies, and lobbies. I am interested in using my final project as a educational tool for my class next semester, so the work can inform how I design my project for better interactions with the students.

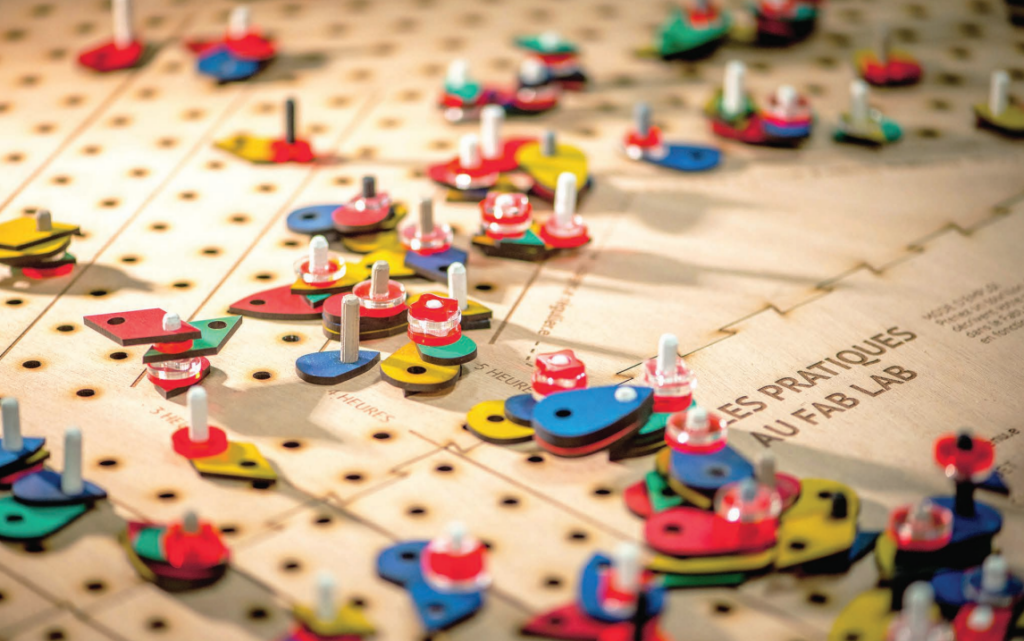
Pauline Gourlet and Thierry Dassé. 2017. Cairn: A Tangible Apparatus for Situated Data Collection, Visualization and Analysis. In Proceedings of the 2017 Conference on Designing Interactive Systems (DIS ’17). Association for Computing Machinery, New York, NY, USA, 247–258. https://doi.org/10.1145/3064663.3064794
This source described a specific data-related project that was designed so people could interact with it. Through these interactions, the researchers collected data. I was inspired by the interactivity of the project, as well as the way of abstracting data into a physical form.
Process
Model 1: Transportation Routes of Nuclear Waste to WIPP
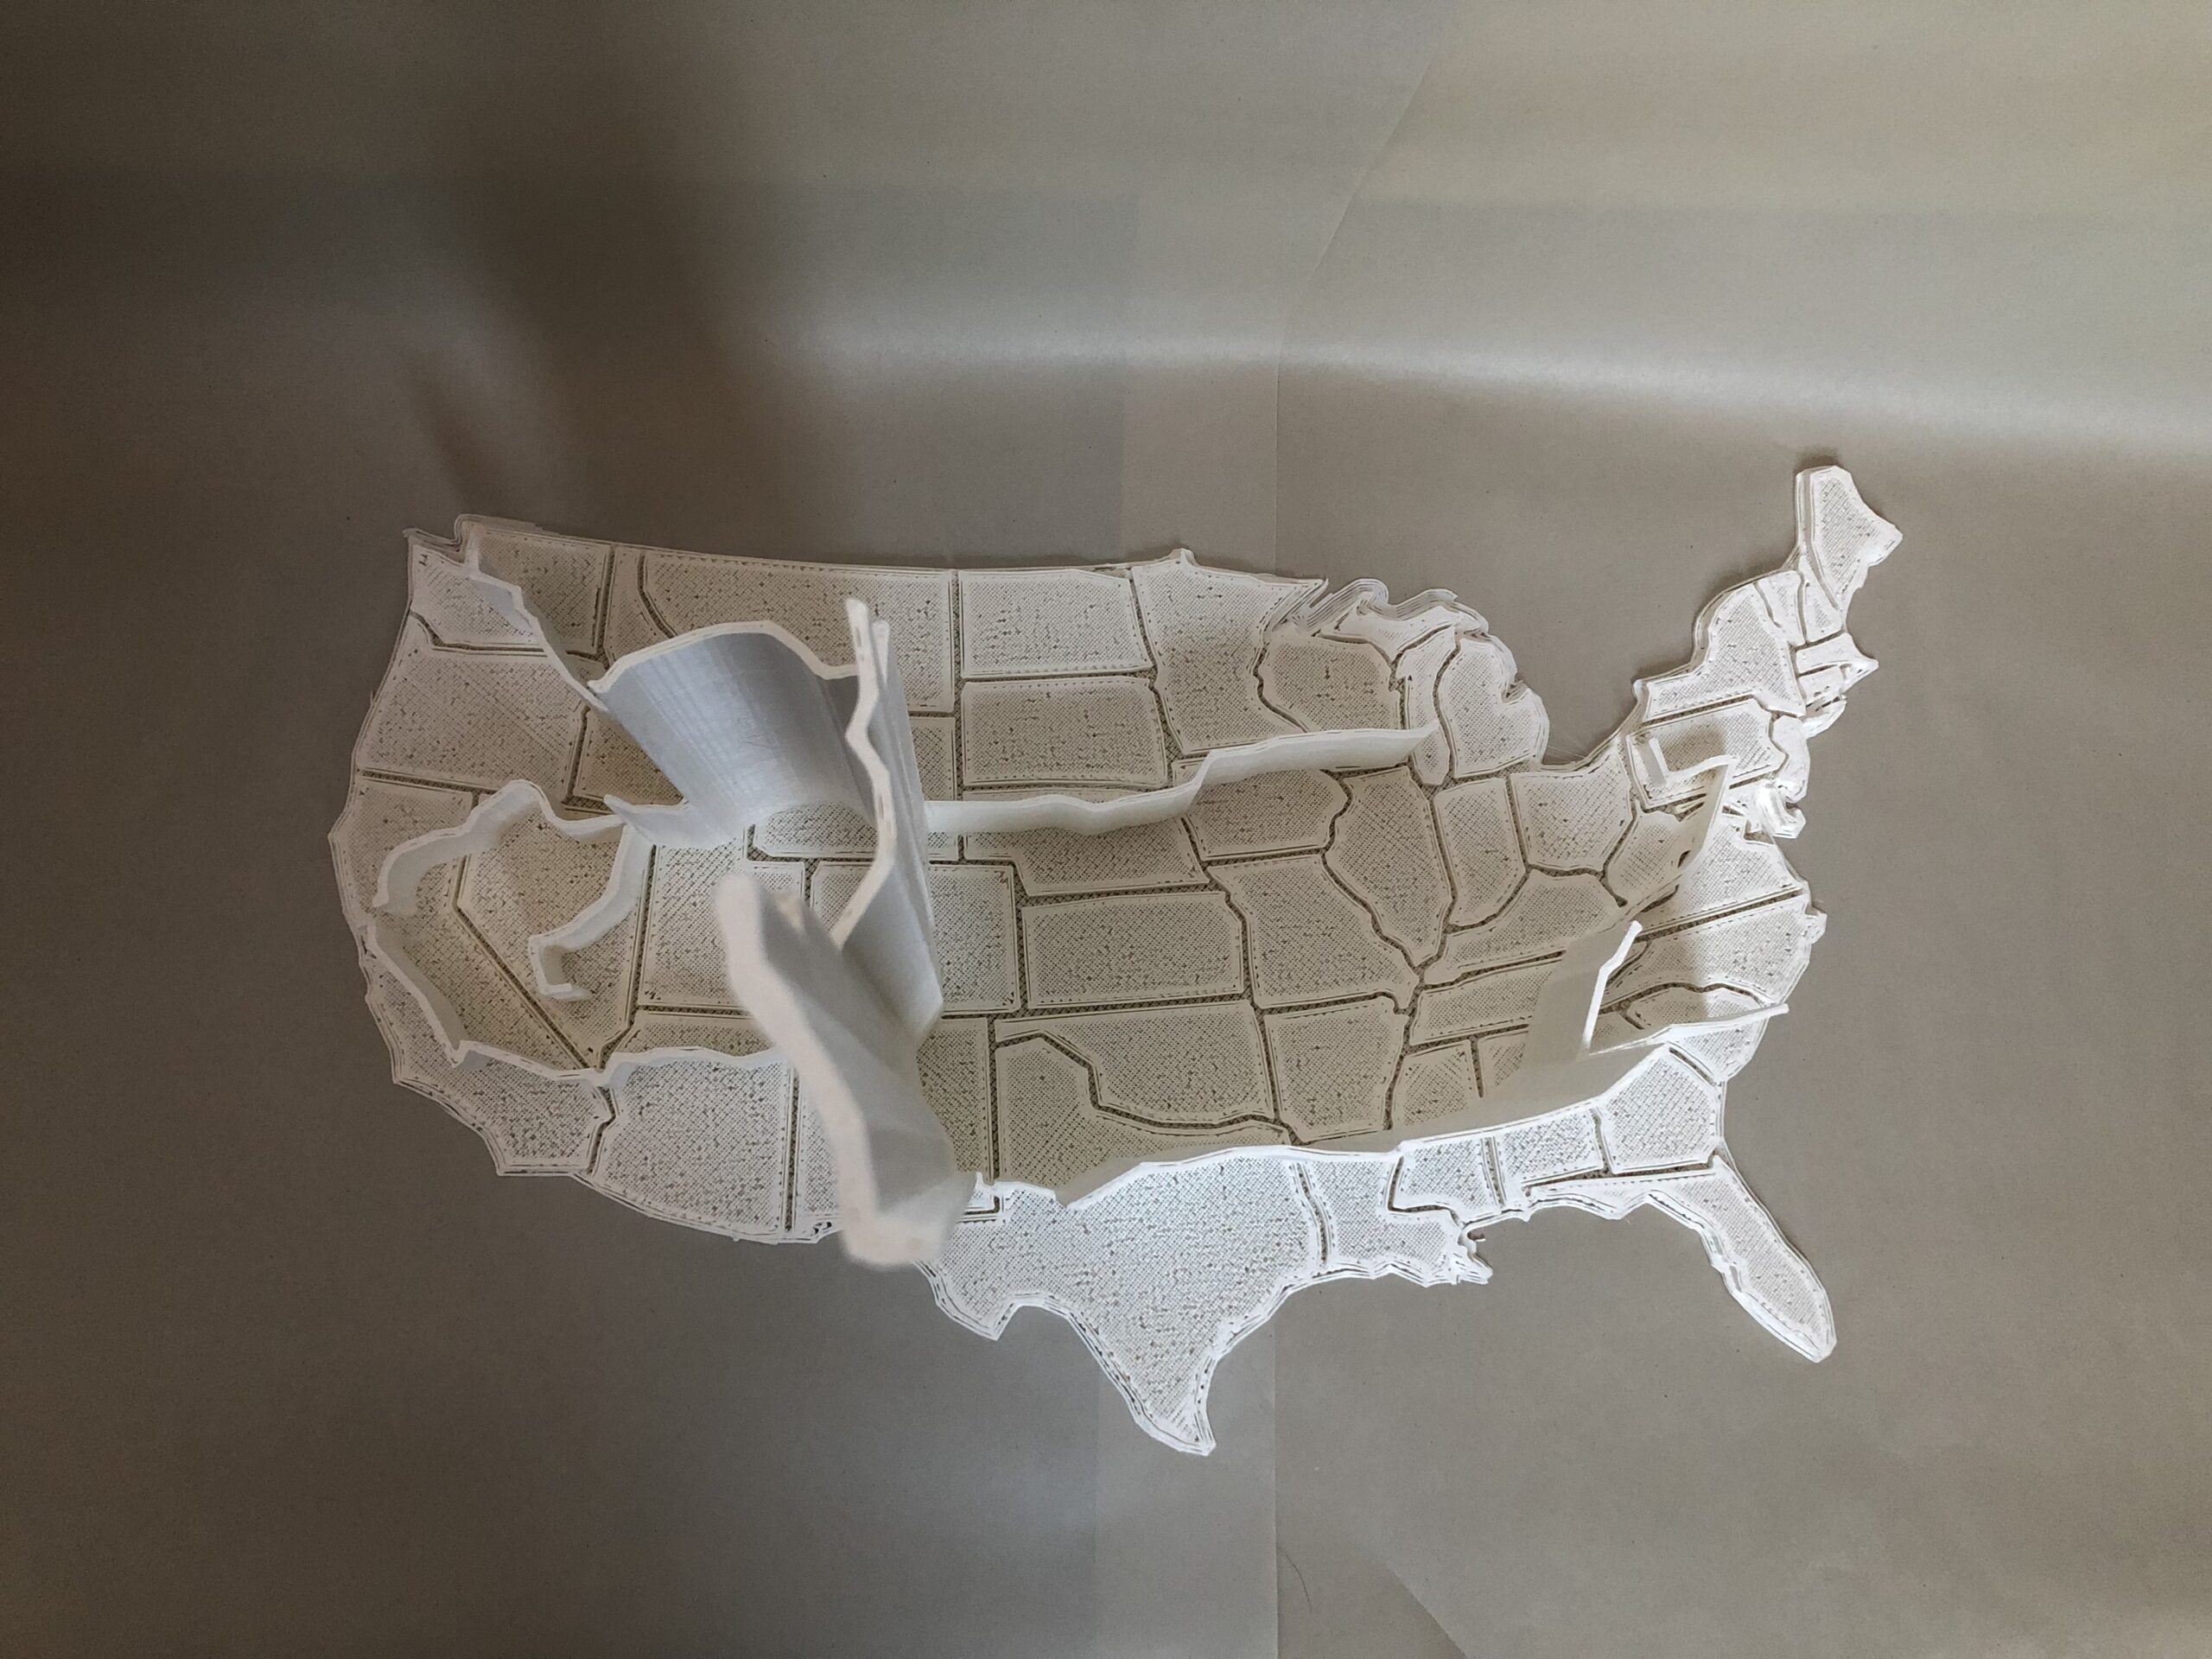
The map is published on the WIPP website, along with the amount of shipments from each source. For the printed prototype, I used a Rhino library called Vectorize to generate vectors from an input image. I then used the curves to generate Planar Surfaces and created individual surfaces for each of the states. Altogether, I was able to print a map of the USA.
Once the foundational map was generated, I traced all of the interstate routes from the image in Rhino and made adjustments to the states so that the image and surfaces lined up. I imported the WIPP shipment dataset into Grasshopper, and I used Python to put the shipment values into a log scale. Then, I divided the interstates into segments that were adjacent to each other and mapped out the route from each of the listed national laboratories. I used the shipment number to increase the height of each segment of interstate.
Although I wanted to create more of a topography surface, this was difficult to implement due to the type of surfaces needed. I explored a variety of Rhino/Grasshopper functions including meshes, Drape, and Loft, but none quite worked. I also realized that creating curved surfaces would obscure part of what I was trying to demonstrate with the data — that there are states/areas which are more affected by WIPP that others. Additionally, it was challenging to find a topography style that would maintain clarity of the interstate routes, so I decided to go with the elevated version instead.
To fabricate this model, I wanted to explore a novel technique. However, due to its 3D nature, I found that 3D printing made the most sense compared to other techniques available to me. Adding in the fact that I haven’t used the Glowforge laser cutter or CNC milling machine before, it was easier to focus on creating a useful 3D printed model than tackling a new machine. I visited the ARTS Lab, and I was able to set up an appointment to print the model. Their 3D printer is a cubic meter in size, so I was excited to try printing a much larger model. The printing itself ended up taking a day and cost $100, but it luckily worked on the first try!
Model 2: WIPP Container Model
For this second model, I did hope to use one of the 2D fabrication techniques, but ultimately did not have enough time. Instead, I opted to generate the models in Rhino and Grasshopper. On the WIPP website, I found information about the various containers used to transport nuclear waste, and I thought it would be interesting to investigate how to represent large quantities using small repeated visualizations, similar to the tiling project and the third source listed above.
In Grasshopper, I created the TRUPACT-II and HalfPACT containers using the images and numbers on the WIPP information sheets. These are both cylinders with a rounded cap. However, it was tricky to figure out how to create the rounded cap at first. I wanted to remain as accurate as possible to the actual containers, so my original attempt to use BooleanUnion on a cylinder and sphere was not sufficient. Instead, I had to try a few more times before I found that scaling the sphere only by its z-axis allowed me to flatten it out enough to mimic the curve of the actual containers. I also went back and forth on a few iterations before deciding to leave the lid off. This choice allows for the drums (smaller cylinders) to fit inside the larger containers, just like how they are packed in real life.
After creating the TRUPACT-II and HalfPACT models, I wanted to also create the drums in hopes of finishing with a set of models that can be used interactively. The drums are cylinders all scaled at different radii to mimic the 55, 85, and 100 gallon drums that the two larger containers are packed with. I used Grasshopper to compute the different sizes and amounts of each drum.
I decided to fabricate this model on my own 3D printer to make it easier to iterate and test prints. I didn’t expect how much time it would take to print a whole set because although they are each small, the sheer amount of cylinders adds up the printing time quickly. This speaks to the greater point of the model though. There are not only many shipments coming into WIPP each year, but each shipment holds up to 3 TRUPACT-II/HalfPACT containers which can each carry hundreds of pounds of nuclear waste. The amount is still difficult to wrap my head around, and I attempted to address the challenge of communicating large numbers.
Outcome
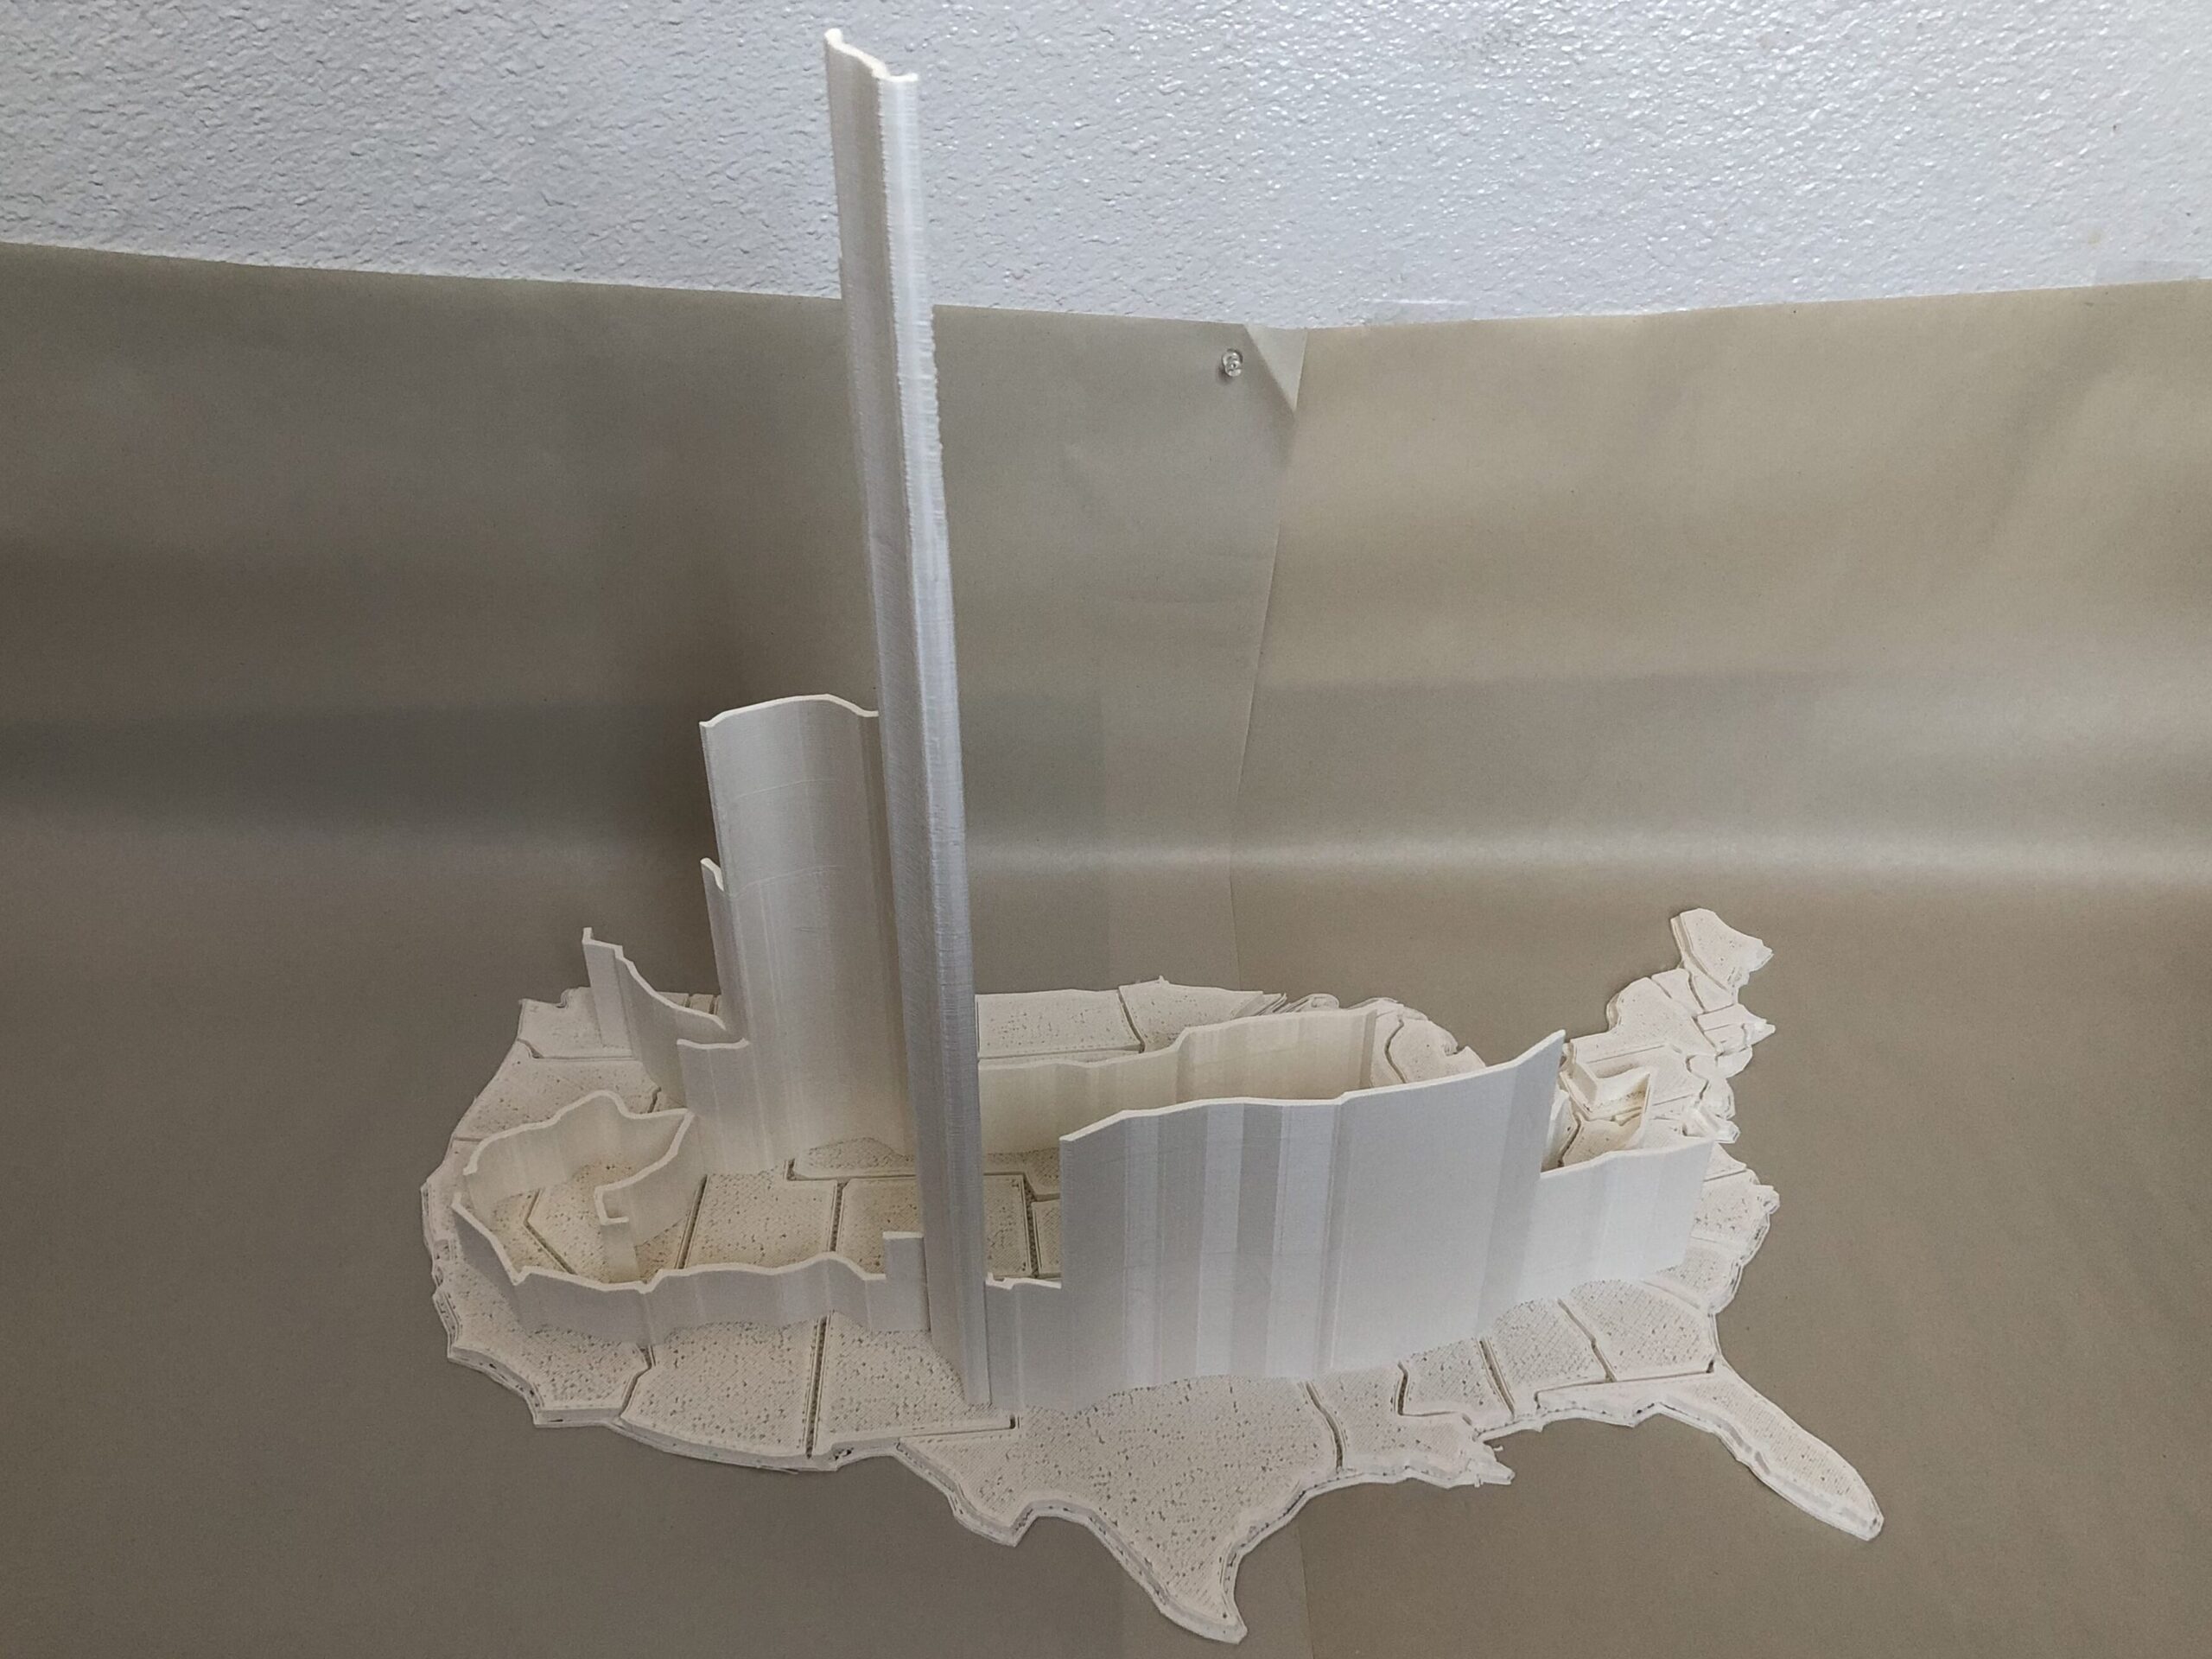
Figure 1. Data Physicalization of WIPP Transportation Routes using shipment amounts as the height
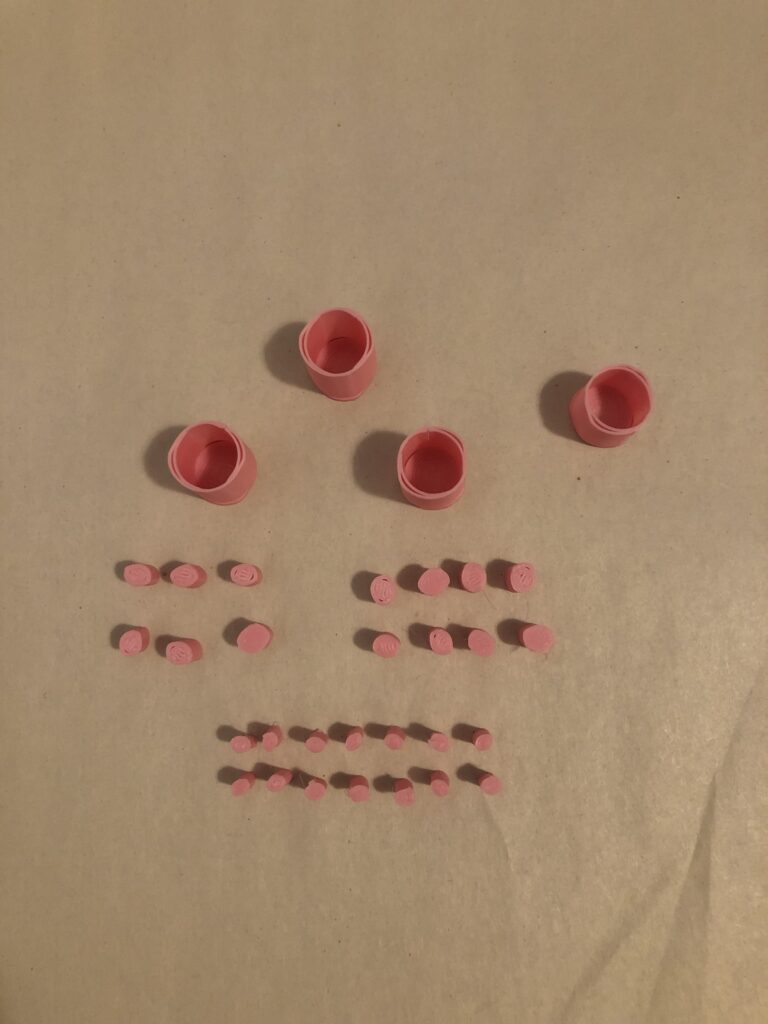
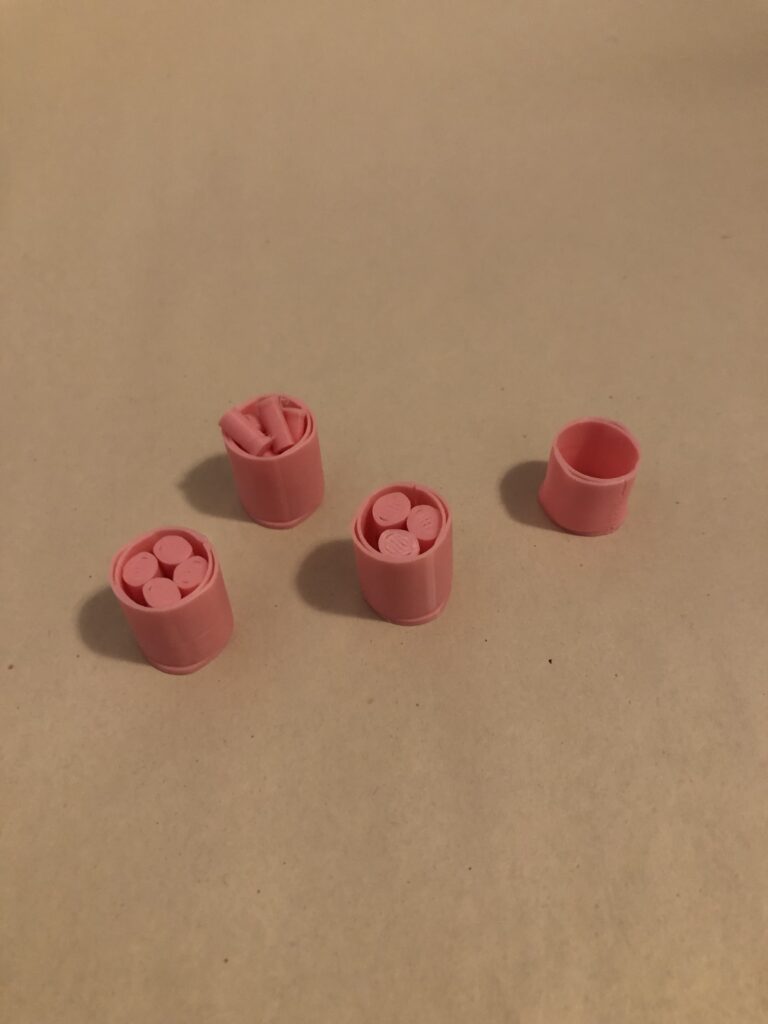
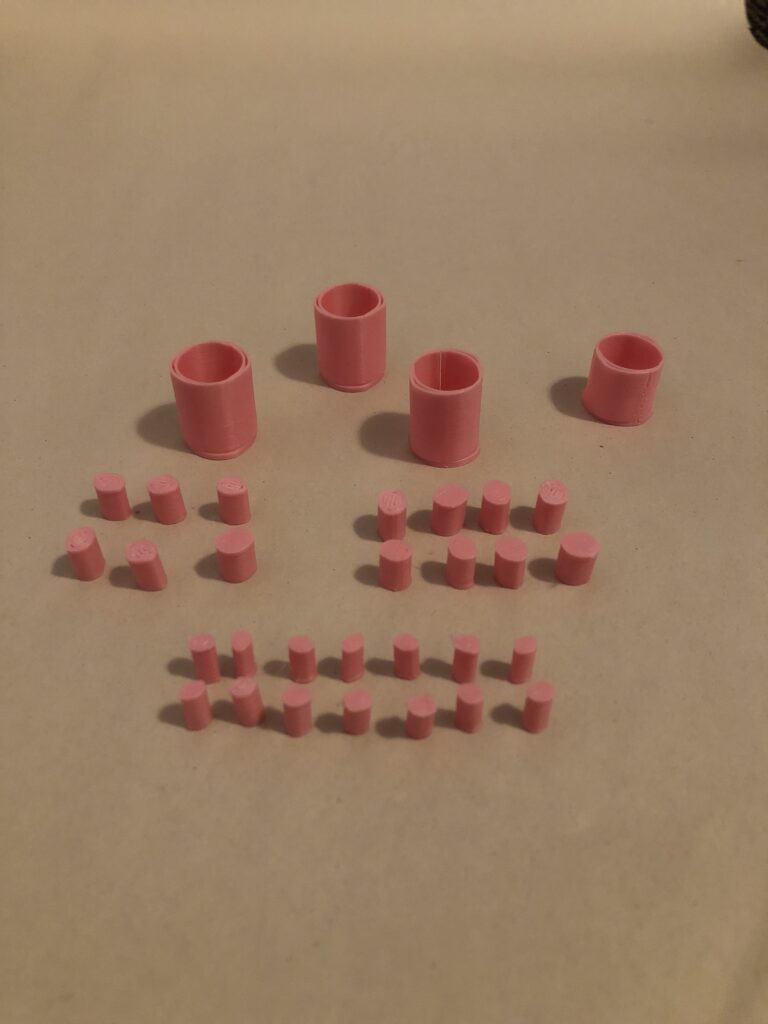
Figure 2. Modeled Shipment Containers. The three larger ones on the left are the TRUPACT-II and the one furthest right is the HalfPACT. Each of the smaller models is the 55, 85, and 100 gallon drums that fit within the larger containers.
Future Work
I would love to finish the third model I had originally planned that focuses on the longevity of radioactive waste. The model would drive home the aspect of time and how the waste will impact us for generations to come. I would also like to explore other fabrication techniques such as laser cutting or CNC milling (which the ARTS Lab offers) to see how using different materials might affect how I present the data.
Reflection
The first lesson was about the challenges of creating a dataset related to this topic. Perhaps unsurprisingly, it was a bit tricky to find detailed information about the nuclear waste stored at the Waste Isolation Pilot Plant because it stores transuranic waste, which is primarily produced in the development of nuclear weapons. Naturally, the government may not be inclined to publish a lot of information about top secret work. Even after finding data, I had to put significant thought into how to best represent the data in a physical form. I wanted to explore new fabrication techniques, but the development of the models ended up being time-consuming, so I had to sacrifice a novel technique for one I was accustomed to. That was another thing I realized through this project; I have developed my skills in design and fabrication quite significantly over the course of the semester. In August, I had never used a 3D printer or any of the software we used in class, and now, I am much more comfortable modeling in Rhino and Grasshopper, using Cura, and of course, using my 3D printer.
Further, I also discovered some interesting work in this area, and it was neat to realize that my own explorations fall into a whole field of research that I did not know about before. I particularly like the community engagement focus of the papers I read because it is appealing to think that our work as computer scientists will be able to reach more people than just our peers. In terms of how I plan to use the artifacts I created, I am co-teaching a class next semester about Atomic Bomb Cultures, and I hope to use this project as an educational tool for the students learning about nuclear waste. Additionally, I am working to plan the final project for the class, so I hope that the artifacts can serve as an example of the type of work students can submit.