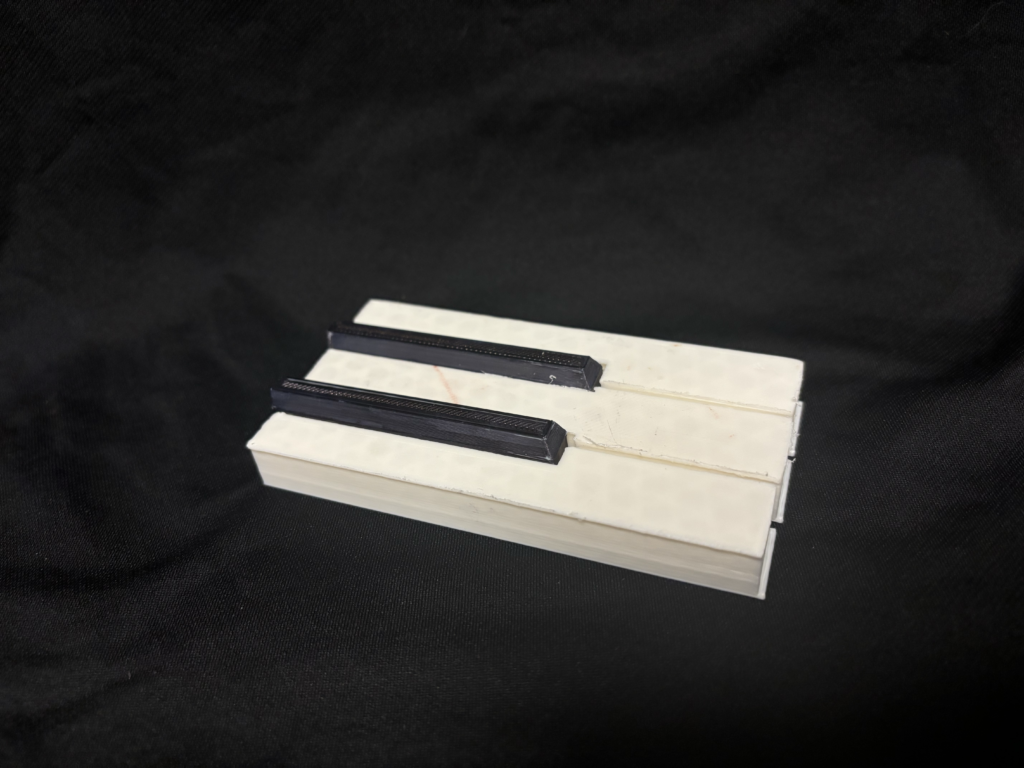
My final project is to create a tangible data visualization that reflects the most frequently played keys on a piano. When I created my roadmap, I wanted the first step to be easy so I could get the ball rolling in the right direction. And that’s exactly what I’ve done. I’m happy to say that I’ve begun producing test prints of simple keys and while doing this, I’ve gotten a better idea of what I want this project to be.

When I first outlined the project, I specified that I ideally wanted to visualize the most frequently played piano keys of all-time. However, I realized that this would be a monumental amount of data to process and clean. So I decided to double down on my alternative option (outlined in my timeline), which is focusing on the most frequently played piano keys of classical compositions, specifically the Etudes of Chopin (Op. 10). Chopin is one of, if not my favorite composers of all time and it’s been a fun experience breaking down the most used piano keys in one of his greatest works. With that said, I am on track according to my timeline. I’ve obtained the relevant data, and I’ve printed a test print of individual keys that will be pieces of the larger model.
Now I can move on to the second week’s tasks, which is to begin translating data into 3D form. I expect this part to require much trial and error, so I’m hoping to make significant progress over Thanksgiving break. Again, I’m expecting to clarify my vision for this project even more in this stage once I get the data represented for each key. Following this stage, I expect the rest of the project’s progress to come quick and effortlessly since all that will remain is assembly and touch-ups of the final model.
Below are my “updated” list of deliverables and timeline/milestones for my project, which have not changed.
Deliverables
- Data-Driven 3D-Printed Piano Keys: Each key will have a unique depth based on play frequency, reflecting the data-driven concept.
- Assembled Piano Model: The keys will be assembled into a single, cohesive model, offering a holistic view of the frequency distribution.
- Digital Documentation: A supplementary digital model in Grasshopper or Rhino showcasing the frequency dataset and how it correlates to each key’s depth, for reference and comparison.
Project Timeline and Milestones
Week 1: Data Collection and Preparation
Goal: Obtain relevant data on piano key frequencies, focusing on MIDI files from popular music genres and classical compositions.Tasks:Download the MAESTRO dataset from Google’s Magenta project, focusing on a subset of compositions for efficiency.Process the data in Python usingpretty_midito calculate the frequency of each note across selected compositions.
Milestone: Generate a note frequency dataset that can be mapped to individual piano keys.
Week 2: Modeling and Test Prints
- Goal: Begin translating data into 3D form.
- Tasks:
- Use Rhino and Grasshopper to create parametric designs for each piano key, assigning depth values to each based on the data from Week 1.
- Run a series of test prints to evaluate the depth representation, ensuring that the cratering effect accurately reflects frequency differences and remains structurally sound.
- Milestone: Complete and approve test prints with desired depth precision.
Week 3: Final Prints, Assembly, and Documentation
- Goal: Print, assemble, and document the final model.
- Tasks:
- Print all keys, ensuring consistency in depth variations.
- Assemble the printed keys into a single model and document the outcome.
- Prepare digital documentation that illustrates the frequency dataset and maps it to the physical keys.
- Milestone: Submit the assembled model and digital documentation for grading and display.