Progress Description
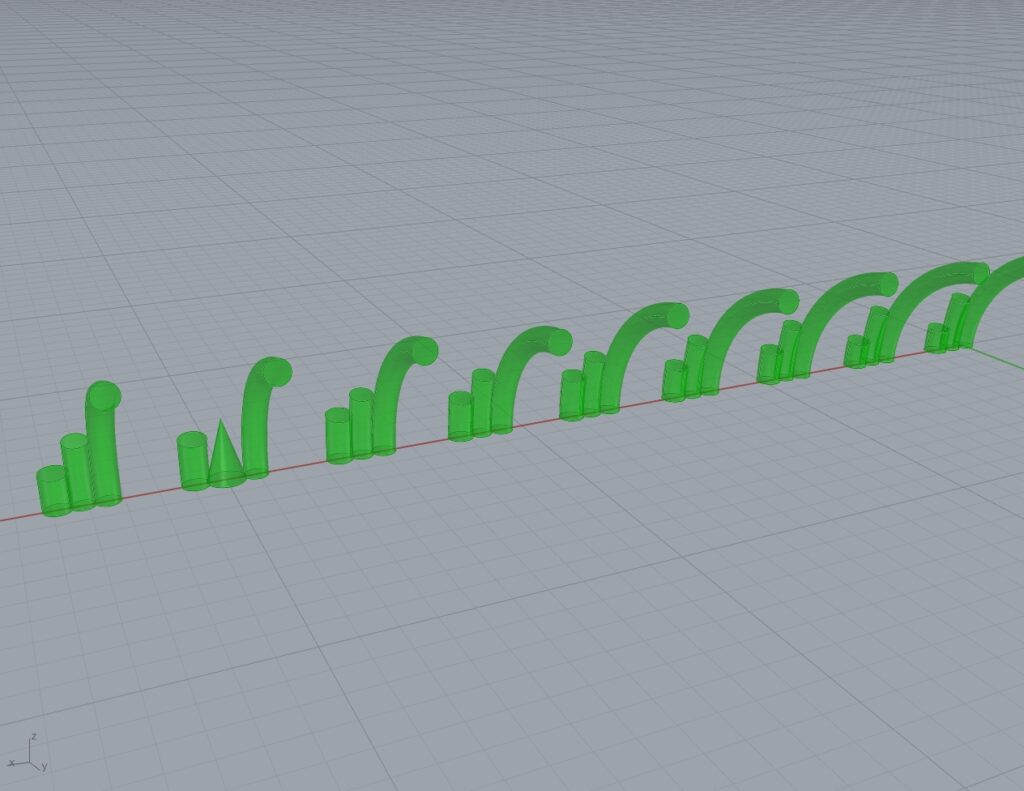
We were able to isolate the desired data and visualize it through shapes. The height of the cylinders is determined by the flow of the pools, the radius is based on the temperature, and the bend represents the ORP (Oxidation Reduction Potential). We grouped the three pools for each day, in the order of Olympic, Johnson, and Therapy Pool (from the largest to the smallest pool). We also encountered an issue with data containing zeros. Instead of leaving blank spaces, I wanted to create another shape to signify that the pool was closed on those days. A cone is used to represent the closed pools. After grouping the pools, we spaced them evenly.
The remaining tasks involve laying the shapes out in a grid format, with each row representing a month and each column representing a day. I think the result might resemble a bar graph because, as I observed the data, there is no consistency in when data was recorded. We are also working on creating a base for the shapes and hopefully connecting them together. I think once those tasks are complete, we can begin printing our final model.
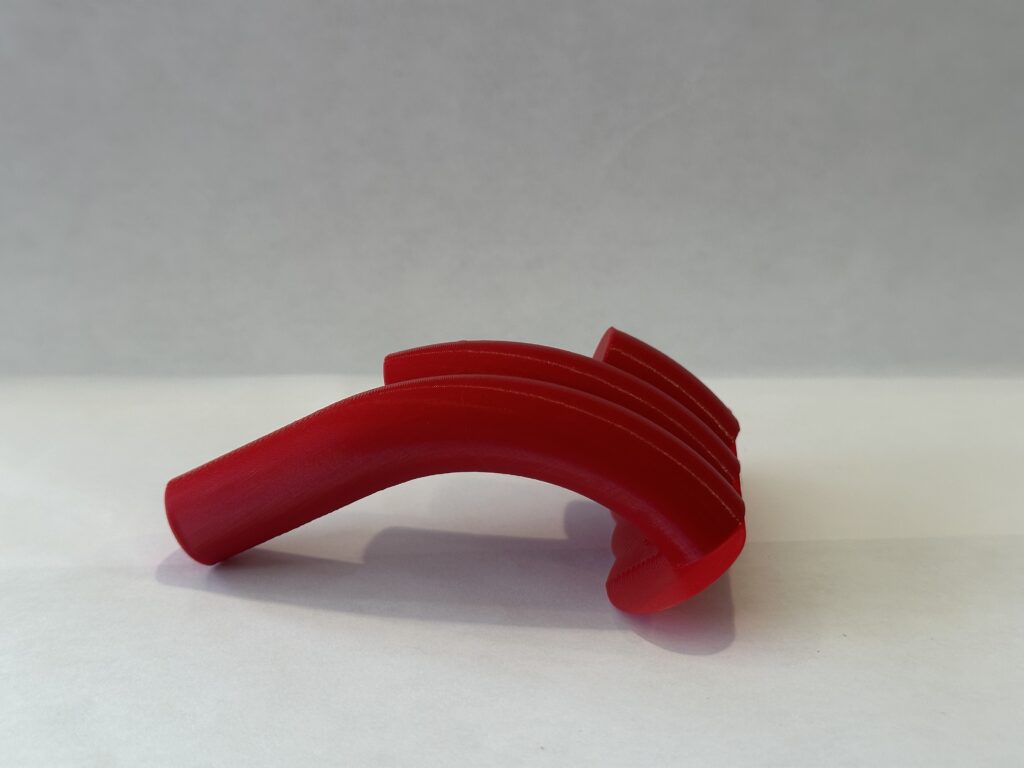
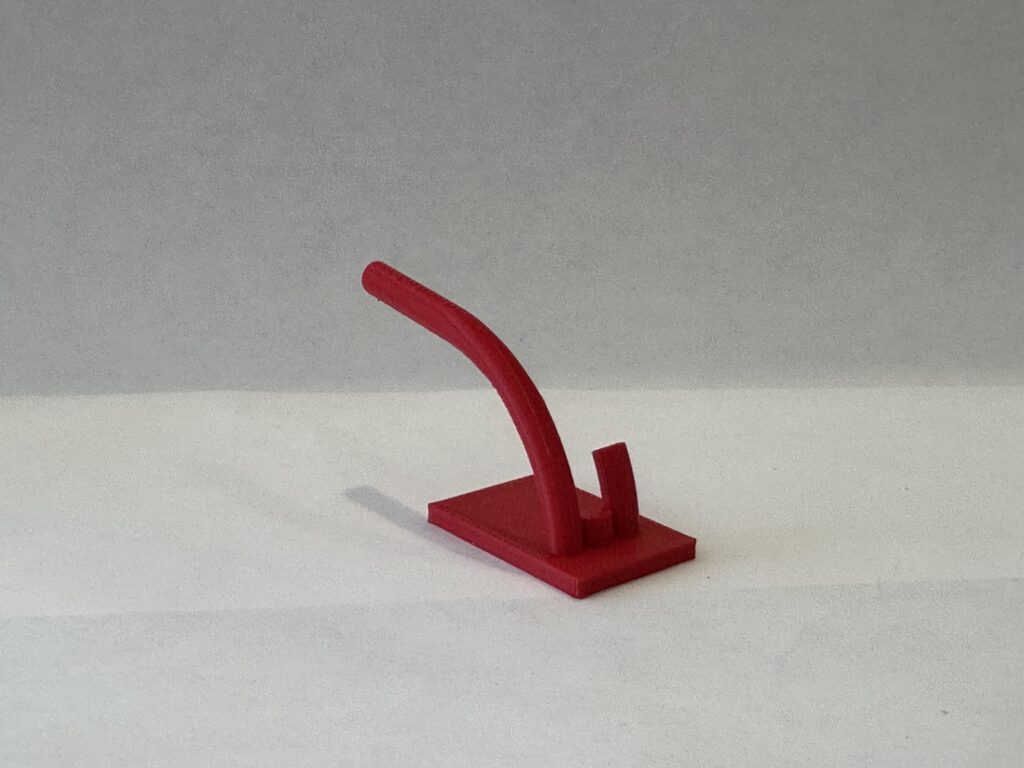
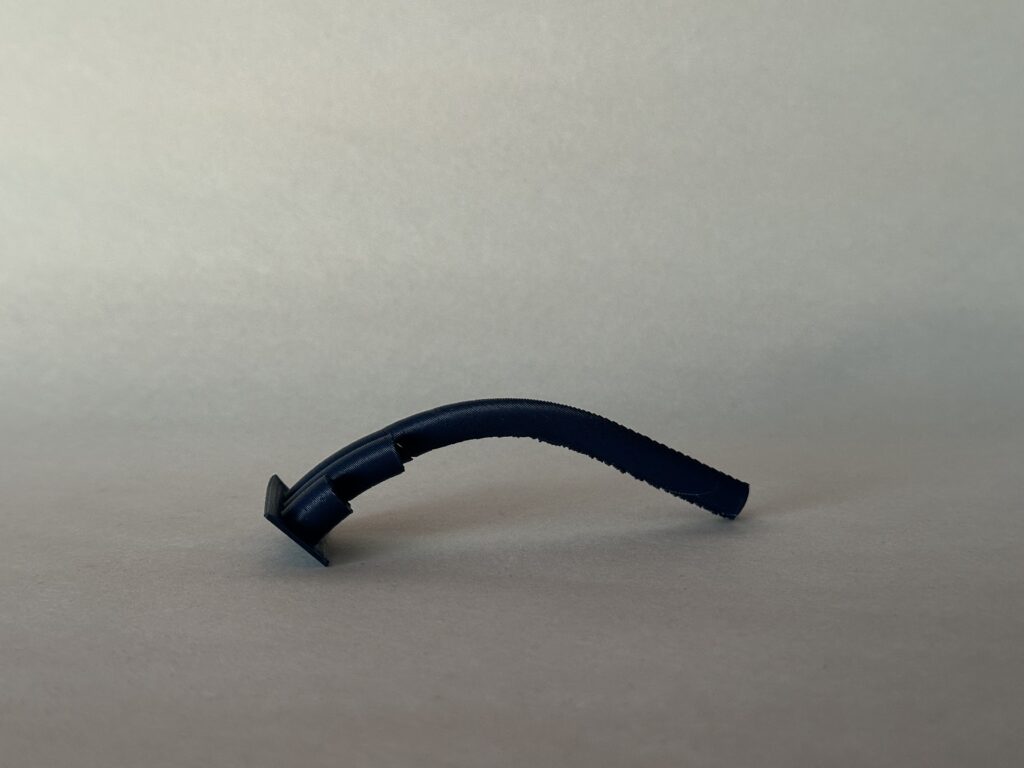
Progress Images


These are our prototype prints, the top left red model was our first print and it came out bigger than we expected. For the next prints we scaled the data down. We also tested out a base for the shape, still needs some work.
Timeline Update
Week 1 (Nov 1 – 11 ) – Organizing the large data set to be parsed, creating the python script to read in / output data correctly in the format we need. Researching what 3 filaments we want to use.Week 2 (Nov 12 – 22) – Inputting the Data into rhino, and testing various visualizations of the data- Week 3 – Nov 23 – 30 – Prototype Prints
- Week 4 (Nov 30 – Dec 5) – Printing / Fixing details of prints / Final Print
Update Deliverables
For our deliverable, we aim to create two abstract 3D prints using seasonal data collected from the three pools during 2020 and 2023. Specifically, we will focus on the pH, ORP (Oxidation Reduction Potential), temperature, and water flow. If we continue to manage our time well, we hope to print the models in different colors depending on the pH levels of the pools. For each model representing a pool, we plan to use a combination of different colored filaments to make the models more visually appealing and interesting. In the end, we hope to create 3D abstract art that can be displayed on a wall.
We plan to construct cylinders for each pool and group them together by day. For each figure, the water flow will determine the height, the temperature will determine the radius, and the ORP will create a bend in the figure. For any zero values in the data, we plan to use a different default shape to represent those instances.
We expect the final model to resemble an oscillating bar graph, as there were variations in the data recorded for each month.