Background:
If you are not knowledgeable about the Powerball lottery I am going to explain it a bit in this section because I did not really understand how it worked before starting this project. In 2024, a Powerball ticket has about 3 important sections. In section 1 you choose 5 numbers (I will refer to these as “White numbers” because on the ticket they are usually white) ranging from 1-69. In section 2 you choose 1 number (I will refer to these as “Red numbers” because these are red on the ticket) ranging from 1-26. These number sets have changed over the years and this is shown in my plots. Finally, in section 3 you can choose to pay an extra dollar to include the multiplier which is a number that is drawn when the rest of the winning numbers are drawn and if you paid the dollar you get to multiply your winnings by this number. The number set for the multiplier is x2, x3, x4, x5, x10. However the x10 multiplier is not included for winnings over $500,000. Certain combinations of correct white and red numbers will get you a certain amount of winnings and getting them all correct wins you the jackpot. If more than one person wins they split the prize money.
DataSet:
I used the government dataset link provided and searched for lottery datasets until I found a fairly clean one with lots of data. I chose this dataset because I felt that I could make a fun and interesting 3d plot that could help my classmates win some money. I have always thought that there has to be certain numbers you could choose for a lottery ticket that would increase your chances of winning if even by a little bit. Luckily for me the dataset I chose was fairly clean to begin with and only had 3 columns with the date, the numbers chosen and a multiplier which I did not include in this project.
Design process:
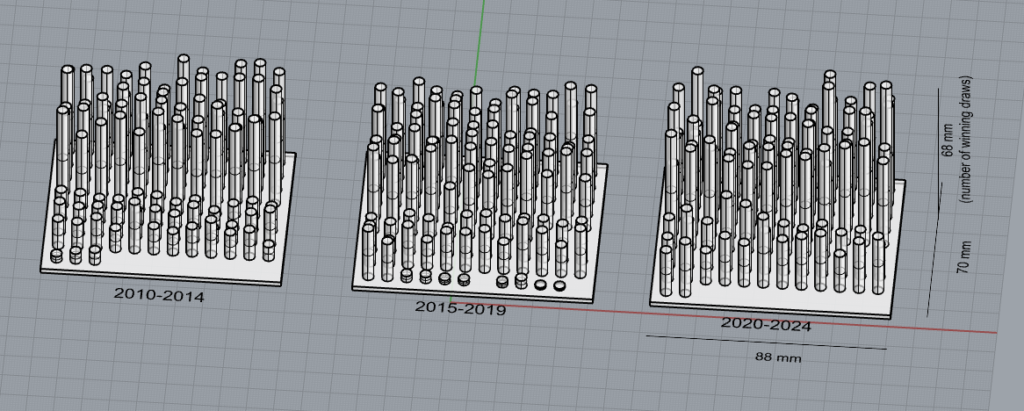
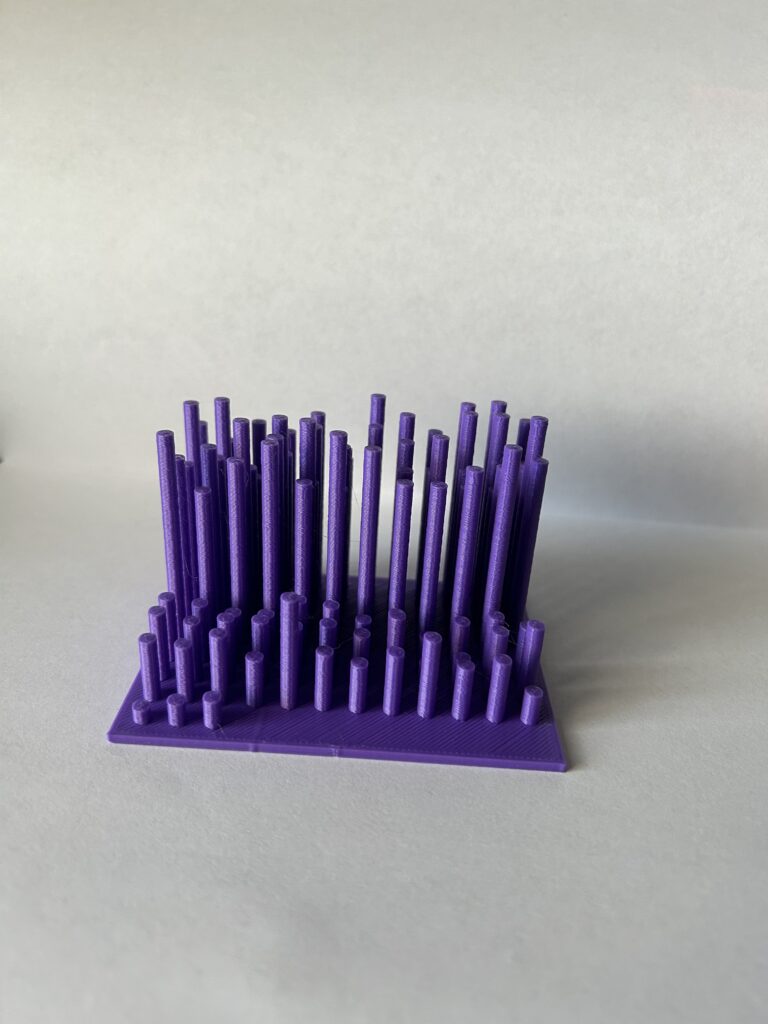
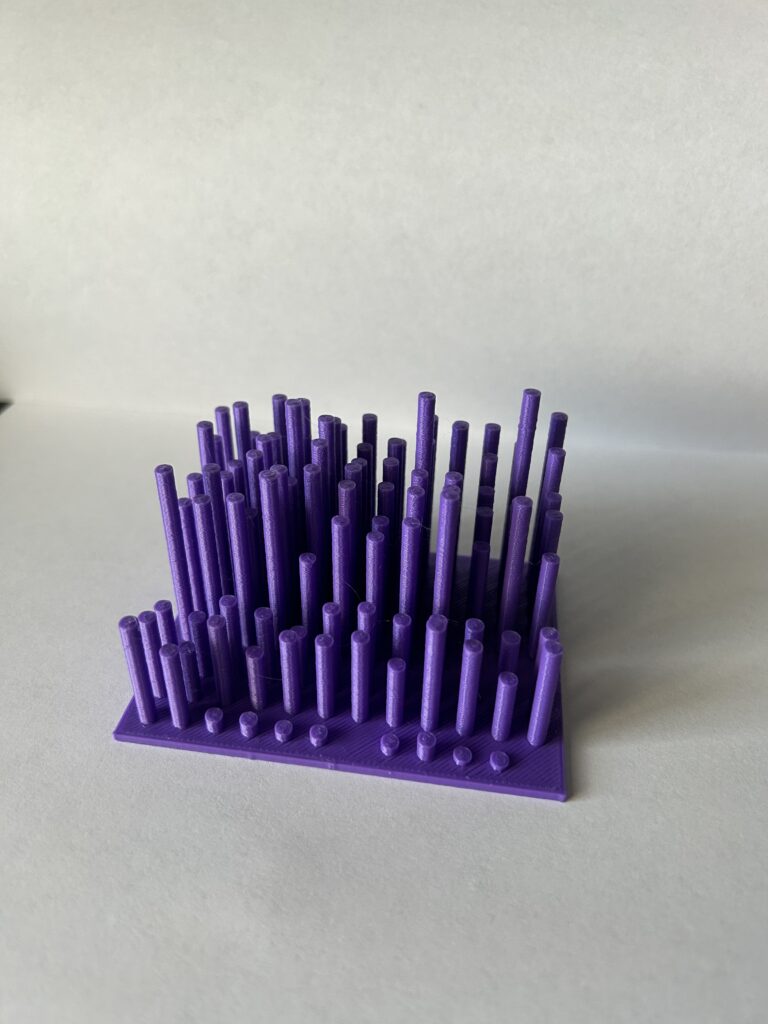
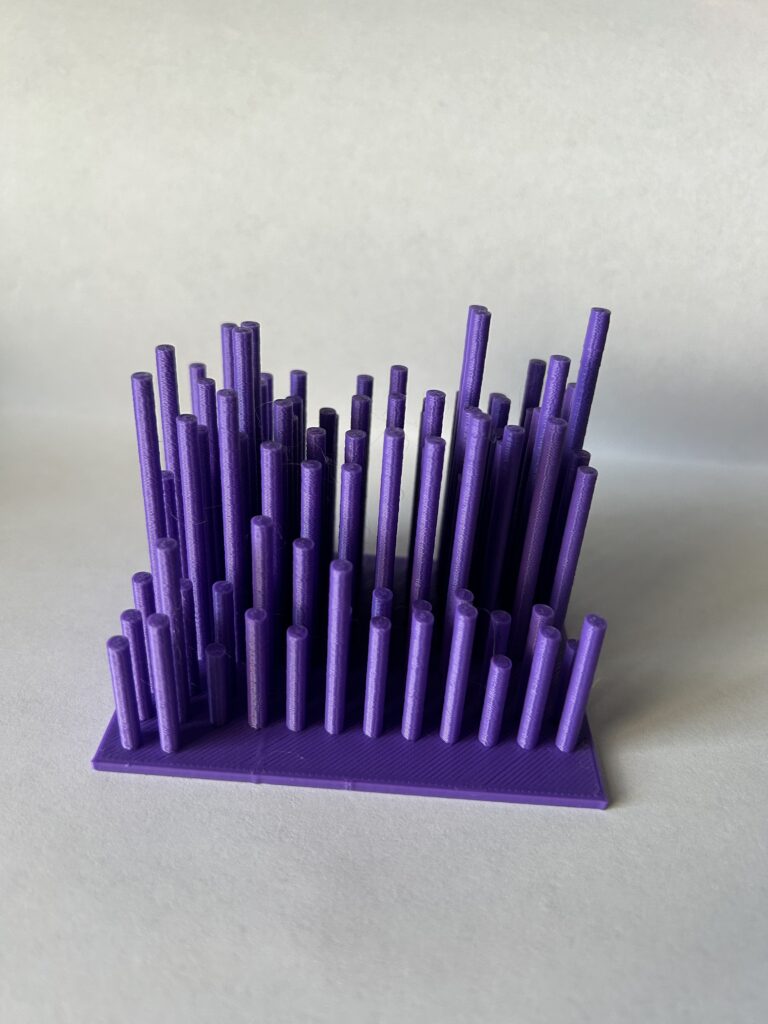
Originally I wanted to make four vessels representing the white and red numbers from 2011-2017 and 2018-2024. This did not end up working out because the data was more random than I had anticipated and I felt it didn’t truly represent the dataset. Instead, I decided to make 3D plots of the dataset in the form of the Powerball lottery tickets you can purchase. I wanted cylinders to come out vertically from the “paper” and their height to represent which ones were drawn more often. I simply iterated over the data set and counted each time a number was drawn and organized these into 3 arrays for the white numbers and 3 for the red numbers for the date ranges: 2010-2014, 2015-2019, 2020-2024. I then set the height of these corresponding cylinders to their draw value where 1 draw equals 1mm. I combined the white and red numbers from similar years into the same plot and separated them according to how it looks on the tickets.
Rhino Images:

Final Artifacts:


Reflection:
I have always been a visual learner and I feel like having the ability to hold and view data in this way can help everyone understand it better than if you just read the numbers in the csv file. Thinking back to the sandbox that we looked at in class I think people learn better through scaled visualization than we think. The sandbox could help people truly understand how forest fires, flooding, landslides and other natural disasters could effect the area they live in. This gives us insight on how events like that could impact us on a more personal level. I feel like the physicalization of data is the best way to learn about real world problems and truly understand the data we can gather.
What numbers should we play if we wanted to win the Powerball with the best chances. In order of most winning draws the data came out to: 39 was drawn 152 times, 36 was drawn 152 times, 23 was drawn 147 times, 21 was drawn 144 times and 32 was drawn 144 times. As for the red numbers: 24 was drawn 70 times, 18 was drawn 69 times and 4 was drawn 68 times. I also expect a 25% cut of the winnings if anyone decides to use my plots for the Powerball.
Hi Patrick,
Your prints were an interesting take on what patterns there are when it comes to the lottery. I feel like this data could be an illusion or misleading if some were to try and use it to predict winning the lottery. For example, if someone chose only numbers with the greatest height on your model, then their chances may be higher. But there is still that random element to the lottery. It was interesting to see this type of data with a randomness element physicalized though. Quality prints!
Hello Jyrus,
I am curious if using these numbers would actually help increase your chances of winning the lottery since technically it is random which number is chosen. But at the same time some of these prints show that there is a large differential between the winning numbers.
Hi Patrick,
I really like the motivation of your project, because in the past, I bought some lottery tickets for some happy things, and in the past I thought that these were all random and you couldn’t control them. But after seeing your project, I found out that I was wrong, it turns out that there are some ways to increase the chance of winning, which is really great!
Hello Qinghong,
I was just as surprised as you are. There is still a bit of randomness to it but we will only know for sure if we try it out. This was a really interesting project and I can’t wait to see how everyone’s prints came out!