Dataset
I chose to use the eBird Basic Dataset (EBD) from the Cornell Lab of Ornithology1. It is a set of crowdsourced birdwatching data. I wanted to use this set because I myself use the eBird app for birding and wanted to utilize the observations made in New Mexico. It is worth noting that this is not a public dataset. Access must be requested at the link below. An eBird account is also required for access. It took around 5 days get access. Once access is given, you can customize the data you want to download rather than downloading the entire dataset. I chose to limit the data to observations made in 2023 in New Mexico.
https://science.ebird.org/en/use-ebird-data/download-ebird-data-products
The EBD is a pretty high-quality dataset, so not much cleaning is needed. The main things to look out for are fields where an empty string indicates absence of a particular data field, such as the ID number for an observation list shared by a group of people. This field contains an empty string whenever the observation in question was made by a singe individual or a group who chose to not combine their lists.
While I didn’t have to do much cleaning, I did need to filter the data quite a lot. The original data has over 30 data fields. For my anticipated needs I only required 12 of them, including the common name of the species, the date of observation, and the number of individuals of that species seen in each observation. I kept the locations limited to recognized eBird hotspots (linked below), as I felt a little weird using data specifically listed as being from people’s backyards. I also had to filter out repeated group id’s, as it was multiple submissions of the same list. Additionally I “added” more data to the set to account for days where no observations of a specific species were made.
https://ebird.org/hotspots
https://ebird.org/region/US-NM/hotspots
Design Process
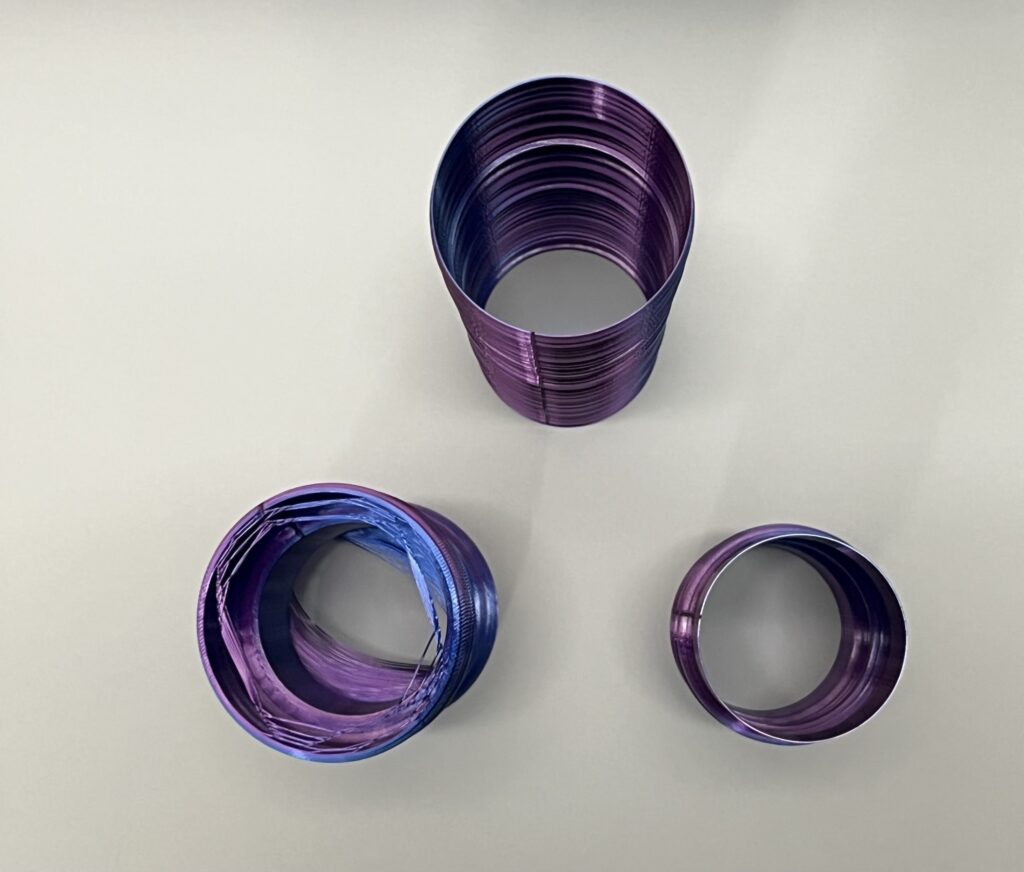
Originally I had planned to create topological maps where the elevation represented observation counts, with the New Mexico State boundaries as the base. Unfortunately that really didn’t work out, so I pivoted to vessel forms. For these I used the revolve technique discussed in class. I successfully created forms for this in Rhino, but the data was so jagged that it created these flat, plate-like formations which are just not printable. To mitigate this I aggregated the data per week and put the results into a log scale. This vastly smoothed out the forms and made them printable.

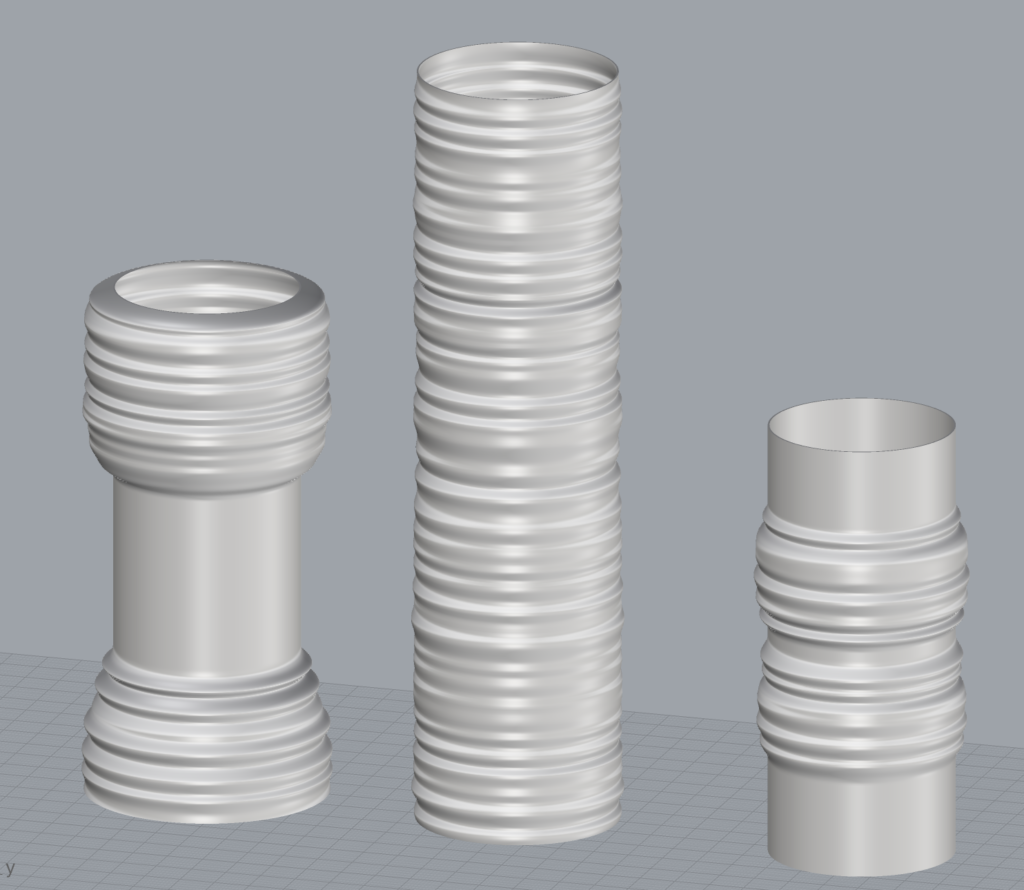
White-breasted Nuthatch (center), and Black-chinned
Hummingbird (right)
I set out to plot observation counts of 3 species, two migratory and one present year-round, at 3 different hotspots over the course of 2023. However, as I worked on the design a more interesting trend emerged, which was the impact of observation frequency on the counts at each hotspot.
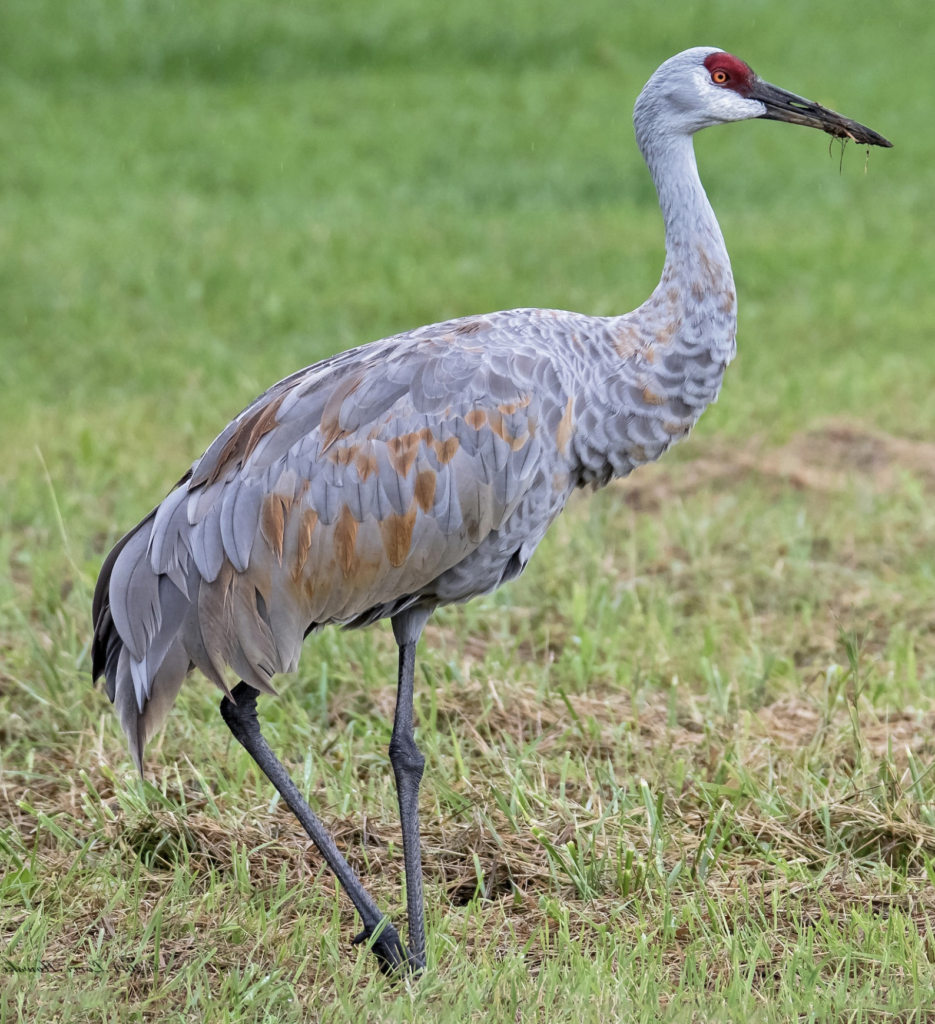
My first vessel depicts observation counts of Sandhill Cranes at the Bosque del Apache National Wildlife Refuge. This hotspot is located just outside of Socorro and hosts the Festival of the Cranes in early December. Sandhill Cranes are migratory birds and can be found in New Mexico from late October to mid-March. During their stay in New Mexico the cranes are widely observed. This is especially the case at Bosque del Apache as the birds gather in the thousands and take off together at sunrise. As a result, huge numbers of observations are reported in November and December. Reports are common but less frequent in other months until the cranes migrate north.

The second vessel represents observation counts of White-breasted Nuthatches at one of the top eBird hotspots in New Mexico, the Rio Grande Nature Center State Park. This hotspot is frequently visited throughout the year, and White-breasted Nuthatches are present in the Albuquerque area year-round. These two facts together yield relatively consistent observations over time.
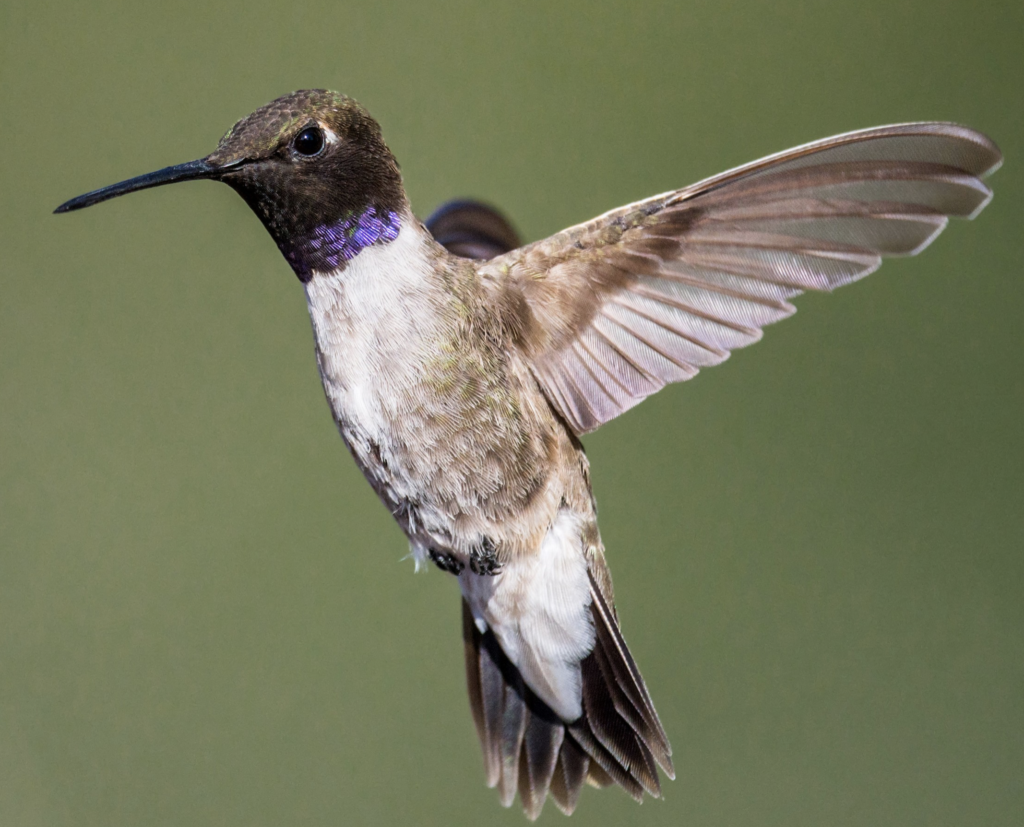
copyright Jim Merritt 2020
https://ebird.org/species/bkchum
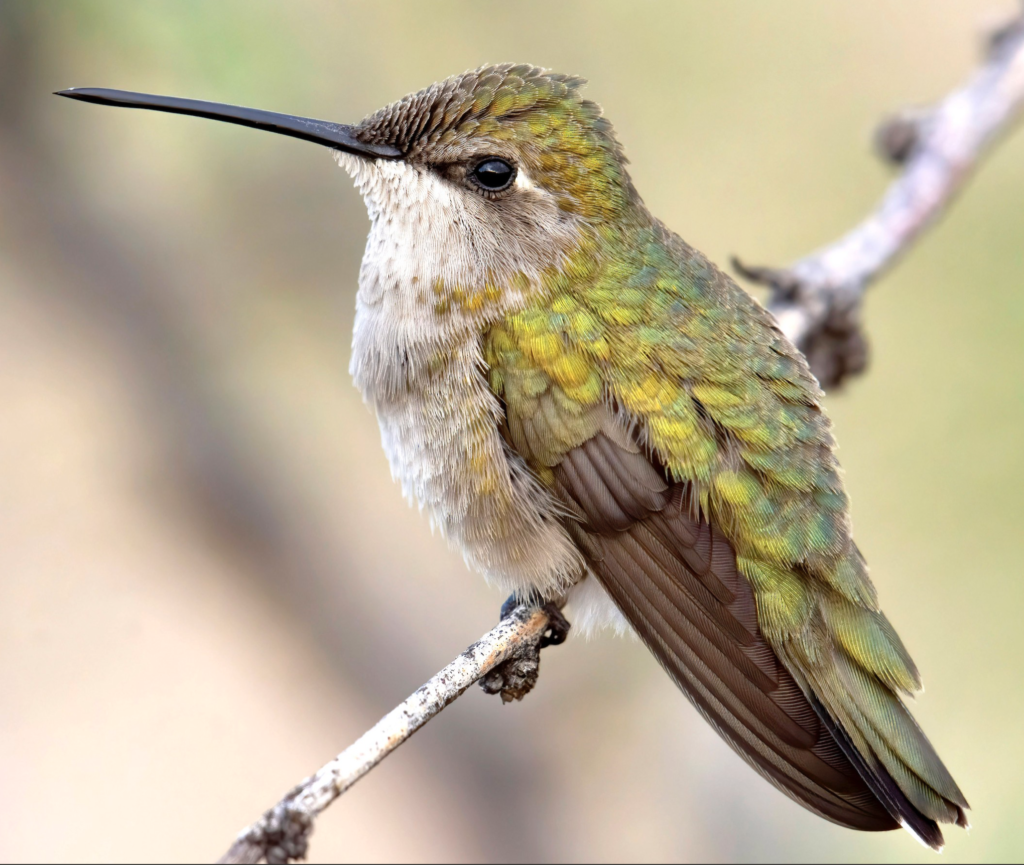
copyright Marky Mutchler 2020
My third vessel shows the observation counts of Black-chinned Hummingbirds at UNM. These birds can be found from mid-March until late October and are a common sight at the Duck Pond. While observation counts of these birds in the Albuquerque area are usually pretty consistent during the warmer months, in my vessel there is a distinct dip in the number observed in the middle. I hypothesize that this is a function of the number of people birding on campus during summer break. There are some observations made, but not nearly as many as are reported towards the end of the spring semester and the beginning of the fall semester.
The scaling for my vessels is shown below. The basic radius was dictated by me to be able to achieve the required dimensions, and so is left out of the scale measurements. Something went majorly wonky with the aggregation of data into “weeks” (units of 7 days), so all the vessels have more than the expected 52-53 “weeks”. Unfortunately I discovered this on Wednesday night with 2 out of 3 vessels printed already.

Final Artifacts
Most of my artifacts printed well. However the Sandhill Crane vessel had some… interesting deviations in the gcode that I didn’t notice until it was printing.

Black-chinned Hummingbird (right)
Reflection
3D data can help people to better understand data. It enables people to experience the data in a visual and tactile way. As bland as my data representation is, it’s nice to be able to feel the ridges and understand where periods of higher levels of bird sightings took place. The example given in the assignment accomplishes this much more clearly, even with only being able to look at Camila’s pieces. 3D plotting really aids in understanding in a way that traditional 2D plots just can’t. Previously I haven’t been able to turn over my data in my hands and physically poke at it. It’s far more intuitive than most 2D plots.
Code
Citations
1 eBird Basic Dataset. Version: EBD_relAug-2024. Cornell Lab of Ornithology, Ithaca, New York. Aug 2024.
Disclaimer
This material uses data from the eBird Status and Trends Project at the Cornell Lab of Ornithology, eBird.org. Any opinions, findings, and conclusions or recommendations expressed in this material are those of the author(s) and do not necessarily reflect the views of the Cornell Lab of Ornithology.
Liz,
I love your choice for the dataset! Birdwatching data seems like a fun one to work with. I wish I would have used your method of implementing the log scale to create more feasible prints that don’t require supports. I used supports for the first time with one of my models and its almost not worth all the hassle that comes with it. It’s unfortunate that you didn’t catch the deviations before you began your prints! I’m surprised the slicer didn’t make it obvious for you. However, I’d have to disagree with a comment you made in your reflection. Your prints are not bland at all! You still found a way to make them different, and they each represent the data very clearly.
Hi Desiree,
Thanks for your comment! The log scale was suggested by Leah. Lol I tried supports for the first time as well on the non-log scale designs. It did not go well. I think the slicer did try to make the issue with my print obvious, I just thought it was an artifact of the visualization. I’m glad the prints are effective in representing the data!
Log Scale! My prints look a lot like your initial designs and they were exceptionally frustrating to print and polish. I wish I’d done something as clever as that. I love how the seasonal sightings is represented on the final forms with these large flat areas where the bird is absent and then pronounced peaks that seem larger than the year round bird. I assume that the spotting get so much higher because of how reliably the seasonal birds can be spotted when they’re in town. I love the practicality of your final forms they’re less dynamic than the unscaled one but much more comprehensible and that I think is more valuable.
Hi Beau,
Using a log scale was suggested to me by Leah. The increased spotting is partially due to the birds’ predictability, but it also is greatly influenced by the number of people reporting sightings. For example, the Festival of the Cranes is one of the top birding, photography, and wildlife events in North America, so there are many more people (and eBird users) than normal. As a result the number of birds reported gets a boost (though having numbers in the thousands is accurate). I’m glad you find the prints comprehensible!
Hi Liz, Great choice of dataset! I think your prints show very clearly the seasonal changes in birding, and I agree with your reflection that the tactile element of physicalizing data really adds to our understanding. I also like that you chose birds that we can see around New Mexico. Was there a reason you went with the thin tube shape? I feel like it fits the vibe of your data nicely.
Hi Sachi,
Thanks for your comments! The thinness of the tubes was not on purpose. I tried to make them thicker, but I think I made an incorrect Rhinoscript call because it just didn’t add any thickness. The thinness did make the print times relatively short though. The longest print took about 3.5 hours.
Liz,
I love that you chose to visualize a data set you are interested in, it shows in the quality of your work and this post. Even though your data is not super varying or unexpected, the way these vessels work together in a grouping makes this a very successful project. Anyone would be able to look at the three and make comparisons to their counterparts, which is a great tool to have made to understand these birds. Great job!
Thanks Astrid!