Studying the population distribution is of great importance: it is widely used in economy, social, cultural studies. How to visualize the population data has been studying by researchers. We would like to apply the things we learnt in class to physicalize the population data.
The county level population data is acquired from 2020 US Census.
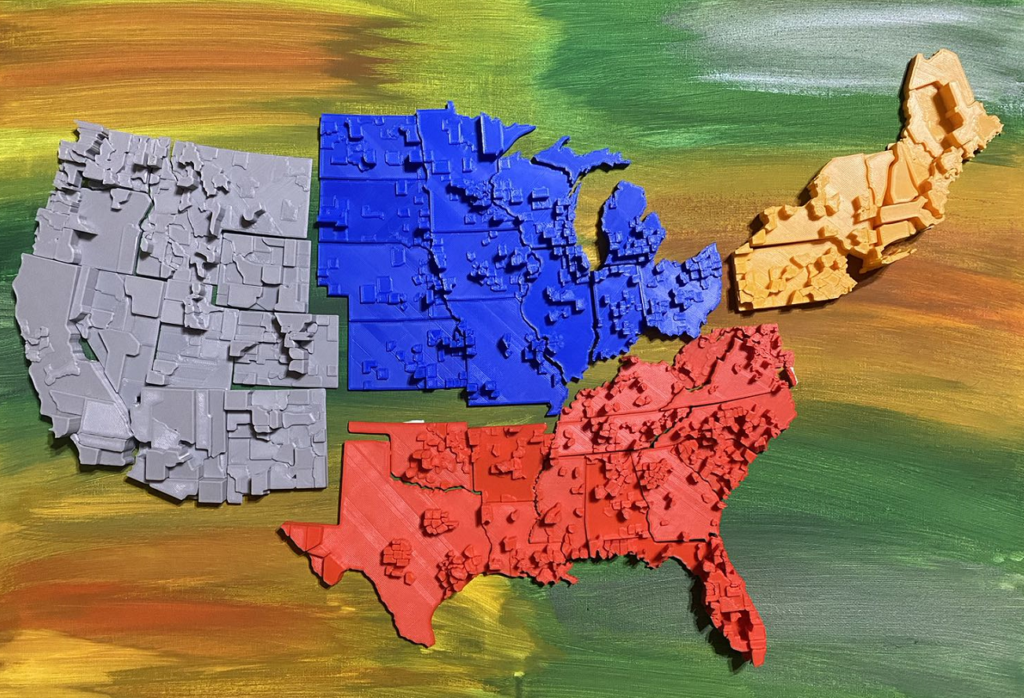
We used height as the population information and printed the entire contour of counties. In this way the final printed results can show multiple information, For example: the contour can show the area of a county, a skinny and tall county means this area has a high population density; a wide and tall county means this area is high in both population and area; a low and fat printing result means this is a highly low-density county. But there is an issue with the height value: we cannot use the population as height directly.
Here is a histogram for the county level population data:
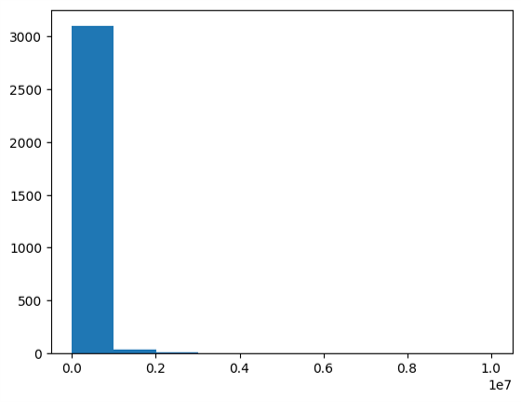
We can see that most counties have less than 100,000 people; meanwhile, there are some outlier counties with several million people. So there has to be some way to convert the population data into a reasonable range. One possible way to do this is to use a log transform; but the Log transform will map the data into a very small range and hence lost some details of the population data: the log of one thousand and one million are pretty similar. So we do some more research of the data and found some interesting facts:
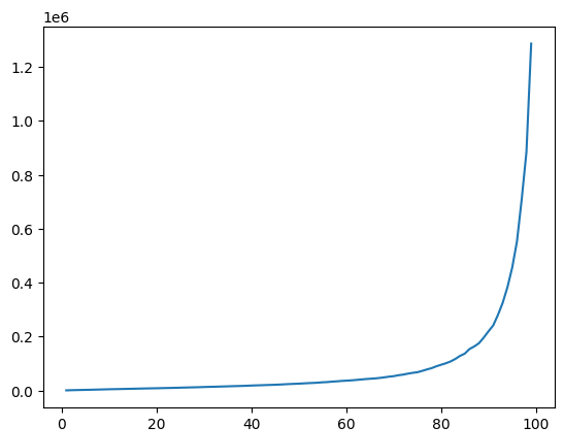
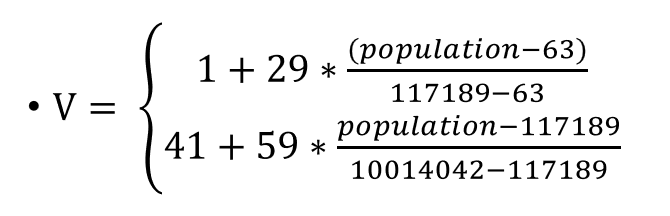
We find the 0th-100th percentile of the population and plot it with the population data, from the plot we can see that it is a roughly bisectional linear function: it is a linear from 0th-83rd percentile, and another roughly linear function from 84th-100th percentile. Hence, the transform is defined as the following:
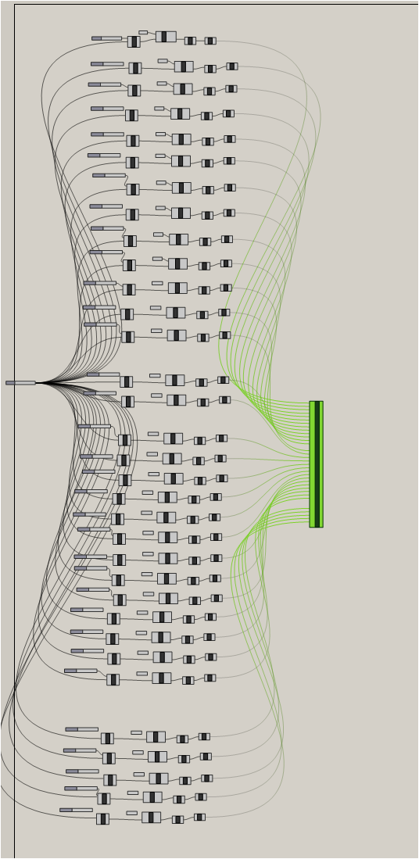
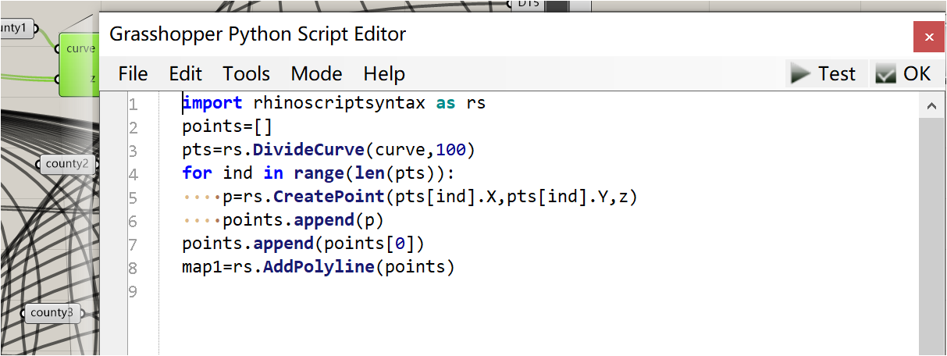
The fabrication process is accomplished by VECTORIZE, a third party plug-in for Rhino that can process image. We extract the contour of the counties in each state and manually assigned a height value to them. The process can be summarized as the following:
For future work:
The whole process should be automated with GIS tools.
Need more wisdom in data transformation (combine log and linear)
Need a criterion to judge physicalization
Adding colors would be interesting; there are already some 3D printers that can print with multi-color fillament.
Some interesting facts:
There are some commonly US county naming conventions: Historical Figures(Washington Counties, Jefferson Counties); Native American Tribe(Cherokee Counties; Apache county); Physical Geography(Lake Counties, Bay Counties, Forrest Counties)
Here is a final result of the printing:
We only upload the west part of the fabrication file. All files size is too large for uploading.