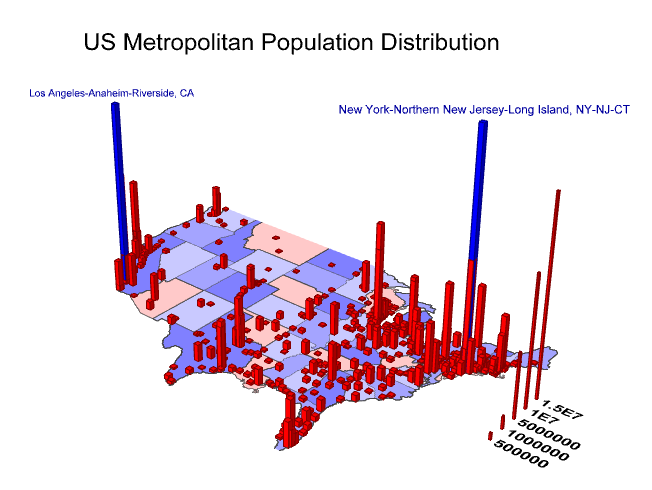
Our target for the final project is to physicalize the county population density data all over US. The final effect will be something like the following graph. We will print each state separately with the same map scale then put all the pieces together. Each state printing result is just like a piece of puzzle. All puzzle pieces can compose the whole US map.
We get the county level high resolution map from this link: https://upload.wikimedia.org/wikipedia/commons/thumb/5/59/Usa_counties_large.svg/1280px-Usa_counties_large.svg.png . There will be five topics we need to solve in this project:
1. How to get the edge of each state and county. There are over 3000 counties in the mainland of US, we need an automatic way to find the edge and map each counties’ name to the edges.
2. How to combine small counties together. There are so many small counties such as counties in new England area, given a limited size and for sake of visual result of the final product we can produce with our 3D printers, counties that are too small should be combined to its neighbor counties to become larger areas. We need a reasonable way to do it.
3. How to convert the bar height into a reasonable range. The population density data of US min 2020 can be found here: https://covid19.census.gov/datasets/21843f238cbb46b08615fc53e19e0daf/explore. The max density is over 27,000 people/square mile. The min is less than 1 people/square mile. Average density value is 112.6 people/square mile. The overall US map bar height cannot be present well if we use the real values since the actual range is so big with a high bias. We need a way to map or group each bar’s height.
4. How to calculate the mid-point of each county? In the large assignment of data chemicalization, the approximate mid points of each county New Mexico are spotted by hand. Here we need an automatic way to get these points for all counties or merged conties in US since there are so many of them out there.
5. How to compose each piece of the products of all states together in a solid way. I am thinking about magnets, glues, or building blocks of joints. Eventually, these pieces should stay together by themselves once they are made.
Our plan is to finish the codes for generating STL files before November 1st. Printing all the state level pieces before November 15th and put everything together before December. Different US regions will be printed in different filament colors. We us the Census Bureau–designated regions and divisions(https://en.wikipedia.org/wiki/List_of_regions_of_the_United_States). This work is inspired by the following papers:
1. Opportunities and Challenges for Data Physicalization | Proceedings of the 33rd Annual ACM Conference on Human Factors in Computing Systems; In this paper, the authors showed several examples of data physicalization examples, one of which is the 3D regional map. They also talked about some challenges in data physicalization, one of these challenges is how to map the data in a meaningful way such that we can physicalize the data with normal equipment.
2. Data Physicalization | SpringerLink; this is another paper showed many interesting examples of data physicalization applications. In this paper, topics such as automation of data physicalizaiton process and data aggregation for physicalizaiton are discussed and is exactly something we are trying to propose some possible solutions.
Hi Jingbao and Lin. I like the idea for your project and I think it would be really cool to see a map of the entire US. I wonder if there is something you could do to your design so that the final piece still conveys the same information, but does not look so similar to the visualization project you were inspired by. One thought I had was what if the whole outline of the county was the height of the bar. The maps I think would then take on the look of a landscape, which I think would be interesting. If you are already finding the outlines of the counties, then you could just extrude that whole shape to the desired height. This would also mean you wouldn’t have to find the centers of each counties.
Hi Jingbao and Lin, I like your idea of creating a puzzle to make a map of the entire US. I would say that maybe try different plateforms of how to present this project. For example making a 3D print model in a landscape perspective like the more points the higher the number and a smoother plan will have less data. Overall, you guys have a great project idea!